Math Activities Library
Explore 150 interactive math activities for middle school students. All activities are aligned with Common Core standards and ready for classroom use.
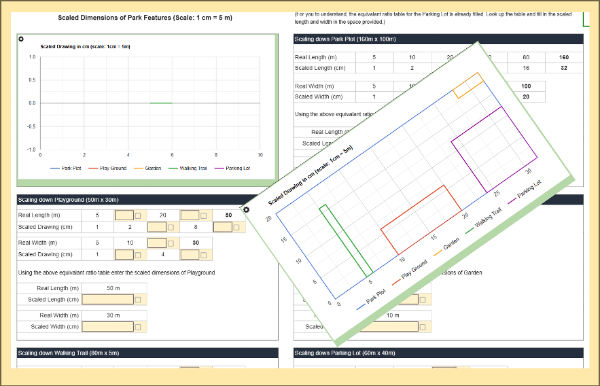
In this hands-on activity, students use equivalent ratios to scale down real-world park dimensions and see their design come to life in an automatically generated graph. As they convert measurements, complete ratio tables, and analyze the final layout, they build fluency in proportional reasoning and visual interpretation.
Grade Levels: [7]
Duration: 15 minutes
Topics: ["Ratio","Multi-Step Ratio Problems"]
Standards: ["7.RP.A.2","7.RP.A.2a","7.RP.A.2b","7.RP.A.2c","7.RP.A.2d","7.G.A.1","7.G.B.6"]
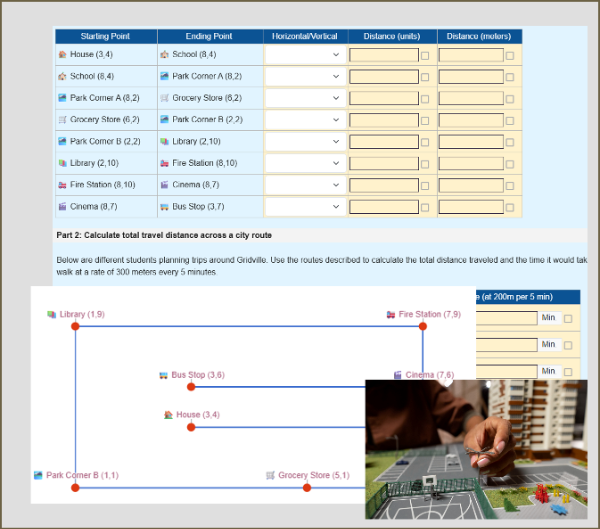
Students use a city map on a coordinate grid to calculate real-world distances between locations, convert grid units to meters, and determine travel times—bringing coordinate geometry to life through practical navigation tasks.
Grade Levels: [6,7]
Duration: 15 minutes
Topics: ["Ratio","Number Line Reasoning","Scale Drawings"]
Standards: ["7.G.A.1","6.NS.C.8"]
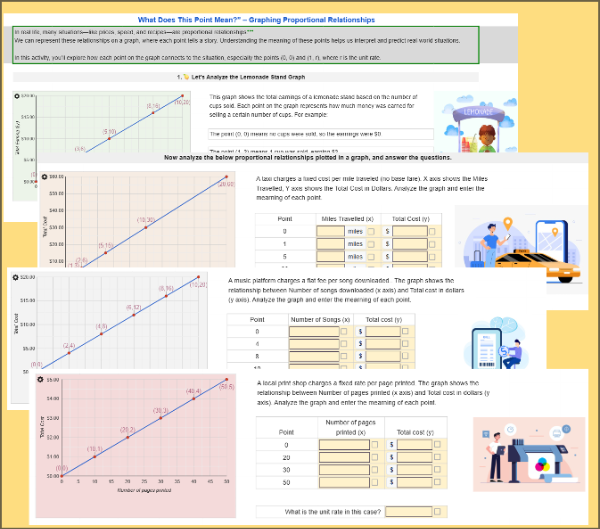
Students explore graphs of real-world proportional relationships—like taxi fares, printing costs, and song downloads—to interpret points and identify unit rates. With minimal reading and strong visuals, this activity builds deep understanding of coordinate graph meaning.
Grade Levels: [7]
Duration: 15 minutes
Topics: ["Unit Rate","Proportional Relationships"]
Standards: ["7.RP.A.2d","7.RP.A.2b"]

Rotate shapes on the coordinate plane to discover how orientation changes while size and shape stay the same. In this interactive worksheet, students apply rotation rules for 90°, 180°, and 270° turns about the origin, record new coordinates, and visualize that rotations create congruent figures.
Grade Levels: [8]
Duration: 30 minutes
Topics: ["Transformations","Congruence and Similarity"]
Standards: ["8.G.A.1","8.G.A.1a","8.G.A.1b"]
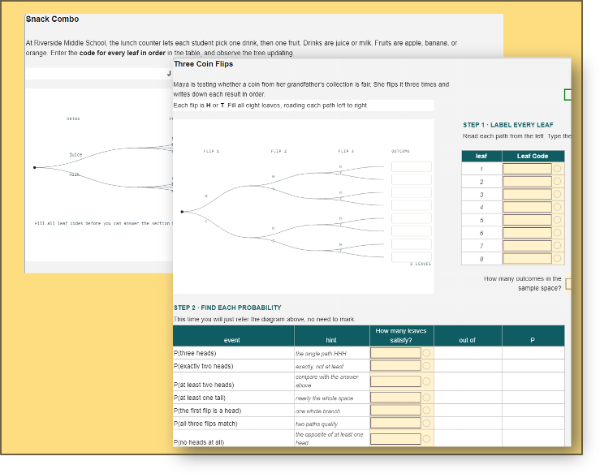
Students build each tree diagram themselves, then use it to find the probability of compound events. Three real-world scenarios covering sample space, organized lists, and counting outcomes. Self-checking with instant feedback, so students catch a missing or repeated outcome as they go. Aligned to 7.SP.C.8a. About 20 minutes, no prep.
Grade Levels: [7]
Duration: 20 minutes
Topics: ["Random Samples","Probability Models"]
Standards: ["7.SP.C.8c"]
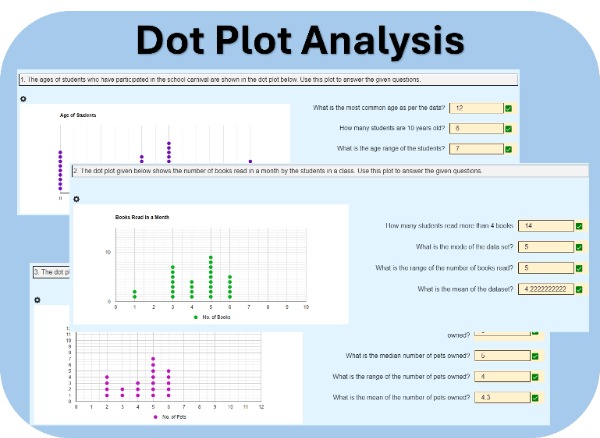
Students will analyze dot plots representing real-world data, such as the ages of students participating in a school carnival. They will answer questions based on these plots. Each student will receive three unique sets of data and questions, encouraging individual analysis and critical thinking.
Grade Levels: [6,7]
Duration: 15 minutes
Topics: ["Random Samples","Interpreting Data"]
Standards: ["6.SP.A.2","6.SP.B.4","6.SP.B.5","7.SP.B.3"]

In this crossword-like puzzle, students will divide integers (positive and negative numbers) and find the answers to solve the puzzle. Each student will receive a different set of questions.
Grade Levels: [6,7]
Duration: 15 minutes
Topics: ["Negative Numbers"]
Standards: ["6.NS.B.3","6.NS.B.2","7.NS.A.2b"]

In this crossword-like puzzle, students will divide decimal numbers and find the answers to solve the puzzle. Each student will receive a different set of questions.
Grade Levels: [6,7]
Duration: 10 minutes
Topics: ["Operations with Rational Numbers","Negative Numbers"]
Standards: ["6.NS.B.3","7.NS.A.2"]
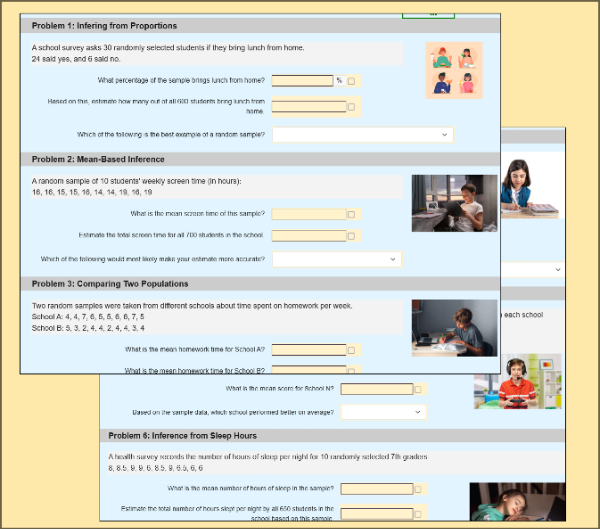
In this worksheet, students analyze six real-world scenarios involving random samples to make inferences about larger populations. They will calculate proportions, means, and ranges, and reflect on the reliability of their conclusions based on sample size and variability.
Grade Levels: [7]
Duration: 20 minutes
Topics: ["Random Samples","Comparing Populations","Interpreting Data"]
Standards: ["7.SP.A.1","7.SP.A.2"]
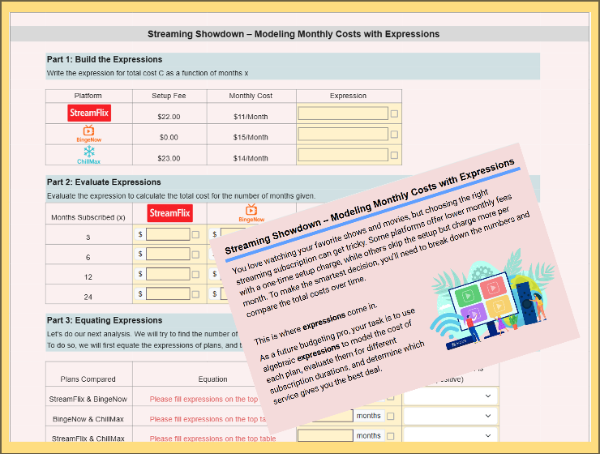
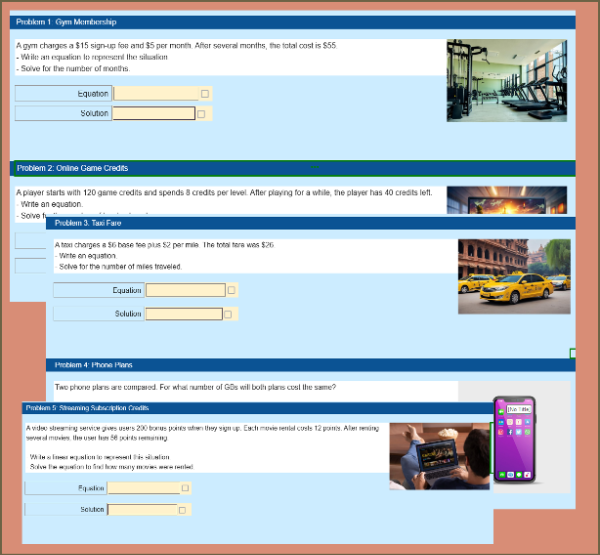
Students compare three streaming services by writing and evaluating algebraic expressions that model total subscription costs over time. They determine which plan is most cost-effective and justify their choice using math.
Grade Levels: [7]
Duration: 20 minutes
Topics: ["Equivalent Expressions","Solving Equations","Linear Equations"]
Standards: ["7.EE.A.1","7.EE.A.2","7.EE.B.3","7.EE.B.4a"]

Students will use the simple interest formula and its variations to find the interest, principal to be deposited, and the interest rate they should be looking for to get $100,000 after 10 years for their dream house.
Grade Levels: [7]
Duration: 20 minutes
Topics: ["Percent Problems","Operations with Rational Numbers","Negative Numbers"]
Standards: ["7.RP.A.3","7.EE.B.3"]
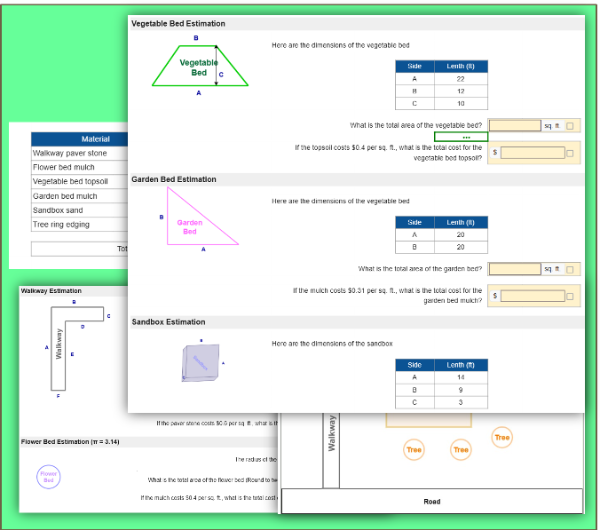
In this real-world geometry activity, students calculate area, volume, and circumference of different landscape features to estimate the total cost of a backyard project. Shapes include rectangles, triangles, trapezoids, circles, and more. A perfect blend of math and practical application!
Grade Levels: [7]
Duration: 20 minutes
Topics: ["Area and Circumference","Volume and Surface Area"]
Standards: ["7.G.B.4","7.G.B.6"]
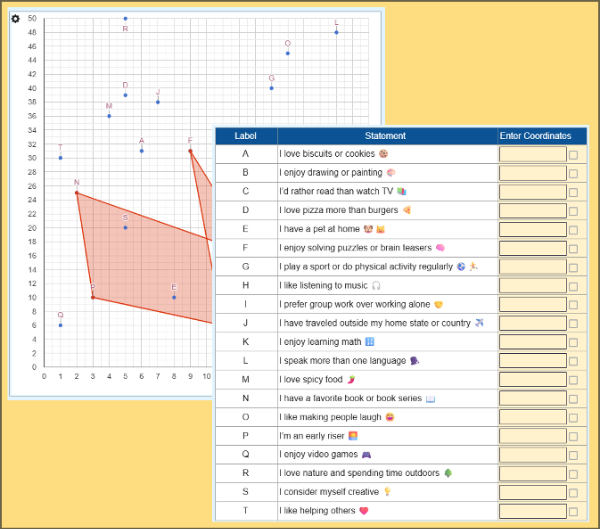
Students read 20 fun statements and choose the ones that describe them. For each, they find the matching point on a graph and enter its coordinates. As they do, a unique shape forms on the coordinate plane. This back-to-school activity falls under Geometry and helps students practice plotting points while expressing themselves.
Grade Levels: [6,7,8]
Duration: 10 minutes
Topics: []
Standards: ["6.NS.C.6","6.NS.C.8","7.G.A.1"]
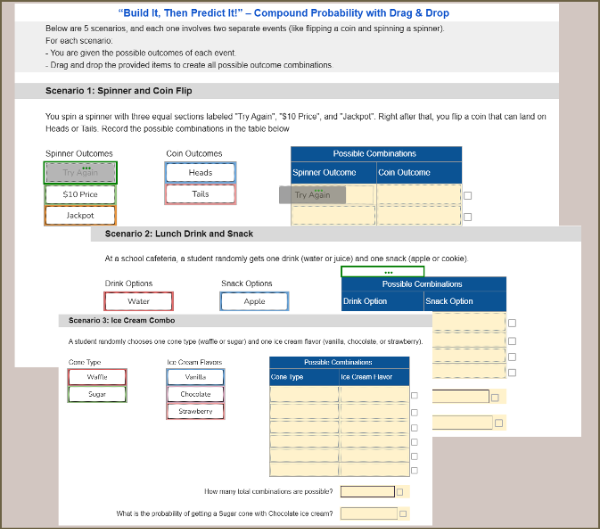
Practice compound probability by building outcome combinations using drag-and-drop. Students explore real-life scenarios and calculate probabilities from organized tables.
Grade Levels: [7]
Duration: 15 minutes
Topics: ["Theoretical and Experimental Probability","Probability Rules"]
Standards: ["7.SP.C.8b"]

The activity revolves around the concept of baking a Christmas cake on a tight budget compared to the cost of purchasing one from a store. Students will be guided through ingredient conversions, cost calculations, and the joy of creating a homemade treat.
Grade Levels: [7]
Duration: 20 minutes
Topics: ["Ratio","Unit Rate","Proportional Relationships","Operations with Rational Numbers","Negative Numbers"]
Standards: ["7.RP.A.3","7.NS.A.3","7.EE.B.3"]

Practice calculating the Mean Absolute Deviation (MAD) of a data set step-by-step—starting from the mean, to absolute deviations, and finally to the MAD value.
Grade Levels: [7,8]
Duration: 20 minutes
Topics: ["Measures of Center and Spread","Interpreting Data"]
Standards: ["6.SP.A.3","6.SP.A.2","7.SP.B.3","7.SP.B.4","8.SP.A.1"]

Students will find the unit rate of seven products in three stores - Farm Fresh, Market Bargain, and Quality stores. They will compare the unit prices and find the cheapest store to purchase each ingredient.
Grade Levels: [6,7]
Duration: 20 minutes
Topics: ["Ratio","Unit Rate"]
Standards: ["6.RP.A.2","6.RP.A.3","6.RP.A.3b","7.RP.A.1"]

Students will analyze four types of graphs: a scatter plot, a histogram, a bar chart, and a line chart. Their task is to interpret the data presented in each graph and answer specific questions related to the information.
Grade Levels: [6,7]
Duration: 20 minutes
Topics: ["Random Samples","Interpreting Data"]
Standards: ["7.SP.B.3","7.SP.B.4","7.SP.A.1"]

Students will calculate the volume of various objects, such as a shipping box or fish tank, using given dimensions. Each student will receive a unique set of dimensions, promoting individualized practice and reinforcing their understanding of volume calculations in real-world scenarios.
Grade Levels: [7]
Duration: 20 minutes
Topics: ["Volume and Surface Area"]
Standards: ["6.G.A.2","7.G.B.6"]
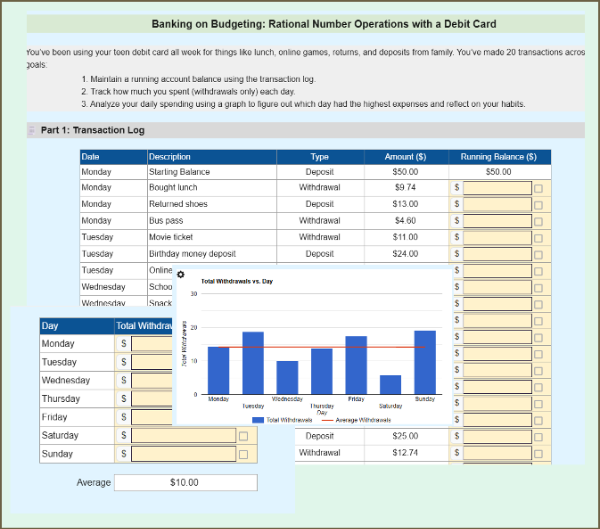
In this budgeting simulation, students manage a week's worth of debit card transactions using addition and subtraction of rational numbers, track their account balance, calculate daily spending, and analyze patterns in their financial habits.
Grade Levels: [6,7]
Duration: 20 minutes
Topics: ["Operations with Rational Numbers"]
Standards: ["7.NS.A.1","7.NS.A.3"]
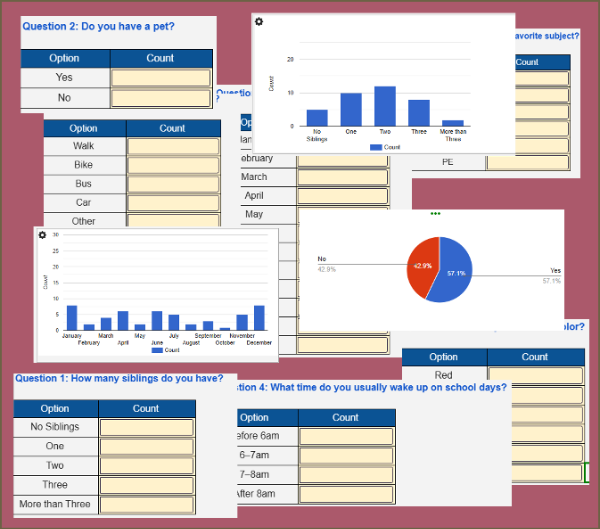
Students collect and summarize data from a live classroom survey on topics like pets, siblings, and school routines. As they enter values, interactive charts update in real time. Students then analyze the graphs and answer summary questions. A fun way to learn data collection and interpretation!
Grade Levels: [6,7,8]
Duration: 20 minutes
Topics: ["Comparing Populations","Interpreting Data"]
Standards: ["6.SP.A.1","6.SP.A.2","6.SP.B.4","7.SP.A.1","7.SP.A.2"]
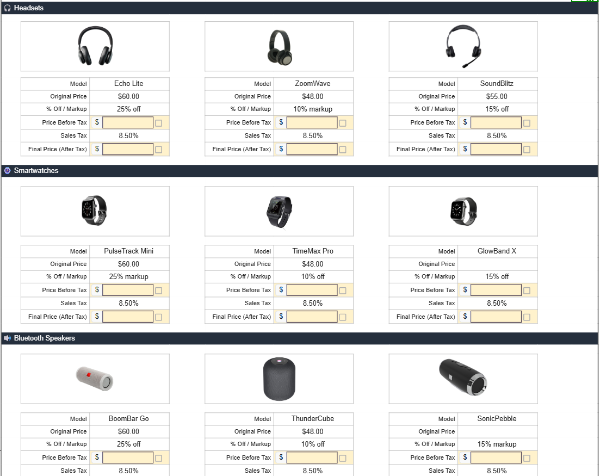
In this real-world math challenge, students use percent skills to shop smart at a tech store. They apply discounts, markups, and sales tax to build a tech bundle within a $150 budget, developing proportional reasoning and financial literacy.
Grade Levels: [7]
Duration: 20 minutes
Topics: ["Ratio","Percent Problems","Multi-Step Ratio Problems"]
Standards: ["7.RP.A.3","7.EE.B.3","7.EE.A.2"]
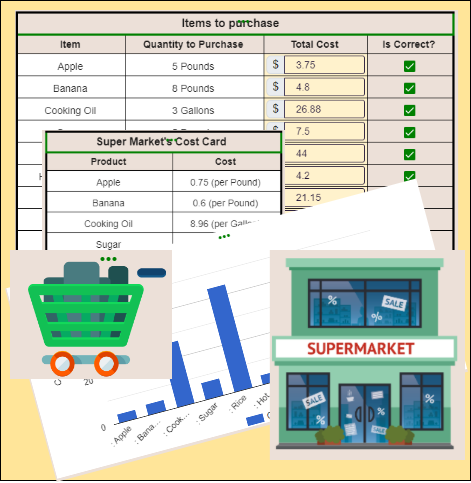
In this real-world math activity, students calculate the total cost of grocery items using unit rates and determine if their $100 budget is enough. Perfect for practicing decimals, multiplication, and proportional reasoning.
Grade Levels: [6,7]
Duration: 15 minutes
Topics: ["Ratio","Unit Rate"]
Standards: ["7.RP.A.1","7.RP.A.2","7.EE.B.3"]
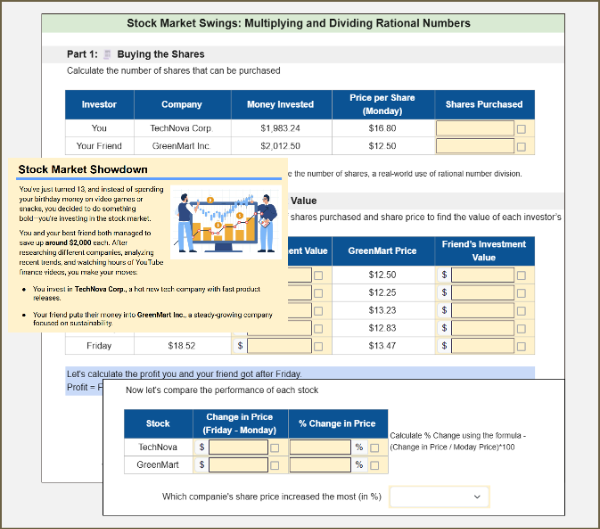
In this engaging simulation, students use multiplication and division of rational numbers to track and compare two stock investments over five days—calculating share quantities, portfolio values, and final profits.
Grade Levels: [7]
Duration: 20 minutes
Topics: ["Operations with Rational Numbers","Negative Numbers","Rational Approximations"]
Standards: ["7.NS.A.2","7.NS.A.3"]

This worksheet helps students identify outliers in scatter plots, calculate the mean with and without outliers, and analyze the impact on the average. It reinforces data analysis skills, helping students understand how outliers affect statistical measures like the mean.
Grade Levels: [6,7]
Duration: 15 minutes
Topics: ["Random Samples","Measures of Center and Spread","Interpreting Data"]
Standards: ["7.SP.B.3"]
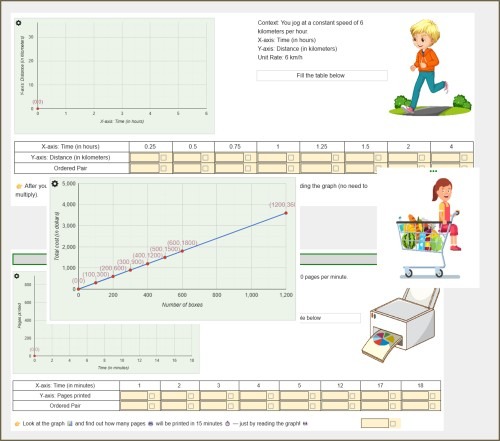
Students explore proportional relationships by completing tables and graphs for real-world scenarios like jogging and packaging costs. They’ll use unit rates, plot ordered pairs, and observe how proportional relationships form straight lines through the origin.
Grade Levels: [7,8]
Duration: 30 minutes
Topics: ["Ratio","Proportional Relationships","Linear Equations"]
Standards: ["7.RP.A.2","8.EE.B.5"]
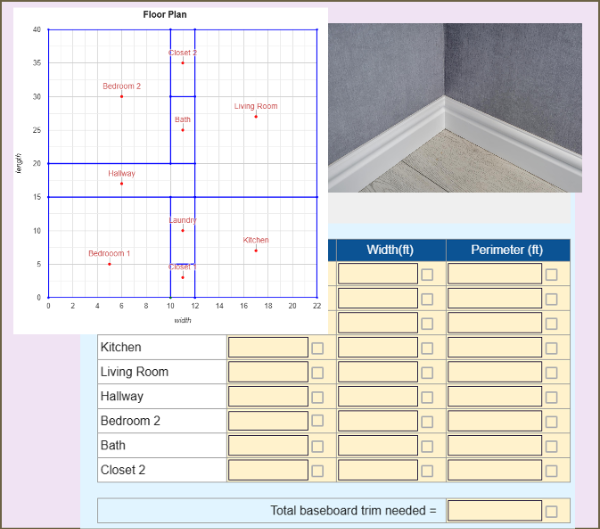
Students use a floor plan on a coordinate grid to measure room dimensions, calculate perimeter, and estimate the total length and cost of baseboard trim needed for an apartment renovation. A hands-on geometry application!
Grade Levels: [7]
Duration: 15 minutes
Topics: ["Scale Drawings","Area and Circumference"]
Standards: ["6.G.A.1","7.G.B.6","7.G.A.1"]
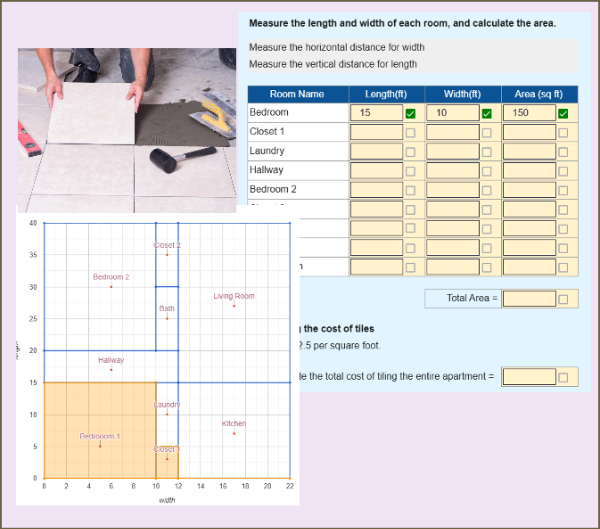
Students measure room dimensions from a coordinate grid-based floor plan, calculate area, and determine the total cost of tiling the apartment. A practical geometry task that connects math to real-world construction!
Grade Levels: [6,7]
Duration: 10 minutes
Topics: ["Scale Drawings","Area and Circumference","Volume and Surface Area"]
Standards: ["7.G.B.6","7.G.A.1","7.G.B.4"]

In this geometry worksheet, students will solve 10 real-world problems, determining whether to calculate the circumference or area for tasks like fencing, painting, or tiling. After deciding, they'll perform the calculations and enter their answers. Each student gets unique dimensions for each problem.
Grade Levels: [7]
Duration: 20 minutes
Topics: ["Area and Circumference","Volume and Surface Area"]
Standards: ["7.G.B.4","7.G.B.6","CCSS.Math.Practice.MP1","CCSS.Math.Practice.MP4"]
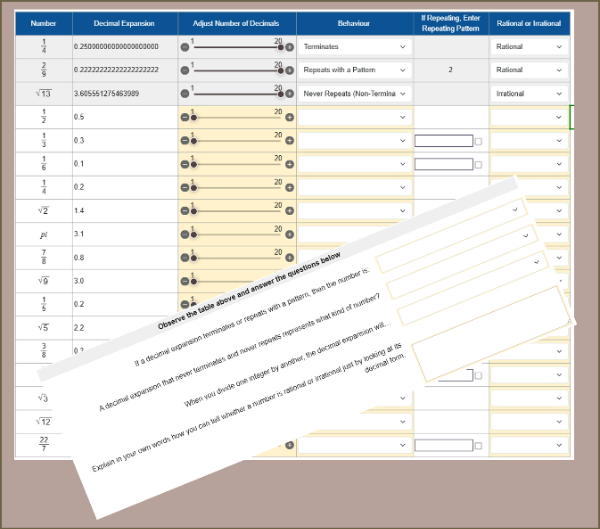
Explore rational and irrational numbers through an interactive decimal slider! Students reveal digits, spot repeating or terminating patterns, and classify numbers. A hands-on way to understand decimal behavior and the difference between rational and irrational numbers.
Grade Levels: [8]
Duration: 20 minutes
Topics: ["Irrational Numbers"]
Standards: ["8.NS.A.1"]

In this spooky Halloween-themed activity, students calculate the speed of different Halloween characters using the speed = distance ÷ time formula and determine who’s fastest in the crew. A fun and educational way to reinforce rate and proportional reasoning!
Grade Levels: [6,7]
Duration: 20 minutes
Topics: ["Ratio","Unit Rate","Operations with Rational Numbers"]
Standards: ["7.NS.A.2","7.RP.A.1","7.RP.A.2b","7.EE.B.3"]
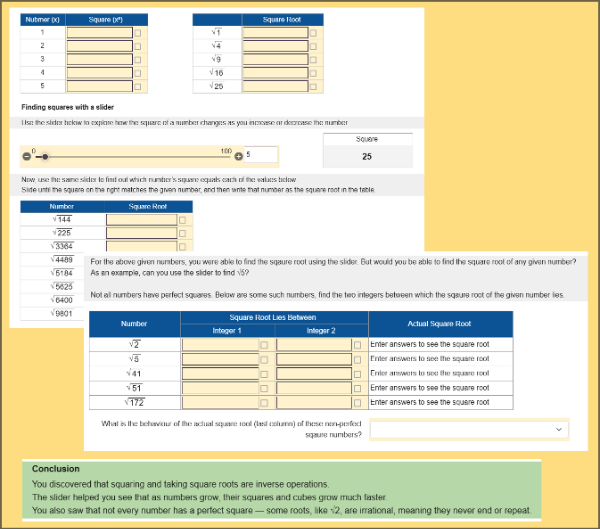
Explore how squaring and square roots are inverse operations through an interactive slider and table. Students calculate squares, find corresponding roots, and estimate roots of non-perfect squares — discovering how rational and irrational numbers emerge through hands-on exploration.
Grade Levels: [8]
Duration: 20 minutes
Topics: []
Standards: ["8.EE.A.2"]
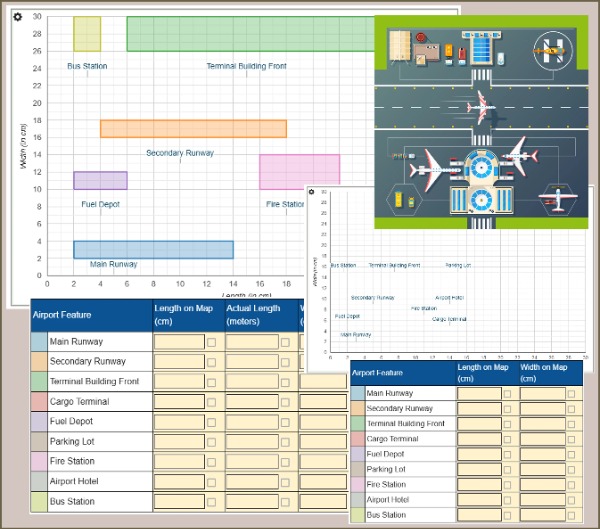
In this interactive geometry activity, students measure features on a scale map, convert to real-world dimensions, then rescale the layout for a presentation. Visual feedback confirms correct answers instantly. A hands-on way to apply proportional reasoning and scaling!
Grade Levels: [7]
Duration: 15 minutes
Topics: ["Scale Drawings"]
Standards: ["7.G.A.1","7.RP.A.2"]
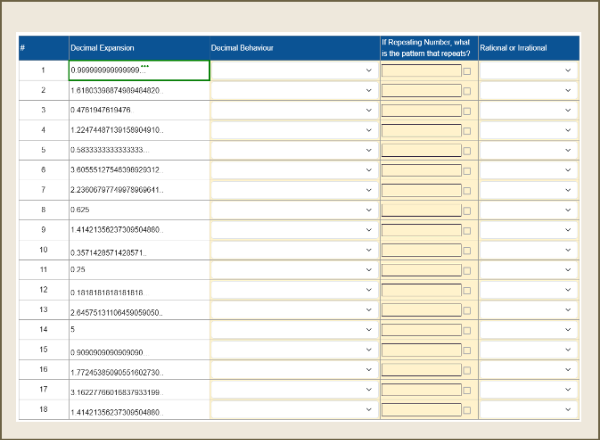
Challenge your students to classify decimals as rational or irrational! In this interactive worksheet, students examine non-terminating decimals—some repeating, some not—to decide which can be written as fractions. A hands-on way to strengthen understanding of decimal patterns and rationality.
Grade Levels: [8]
Duration: 20 minutes
Topics: ["Irrational Numbers"]
Standards: ["8.NS.A.1"]
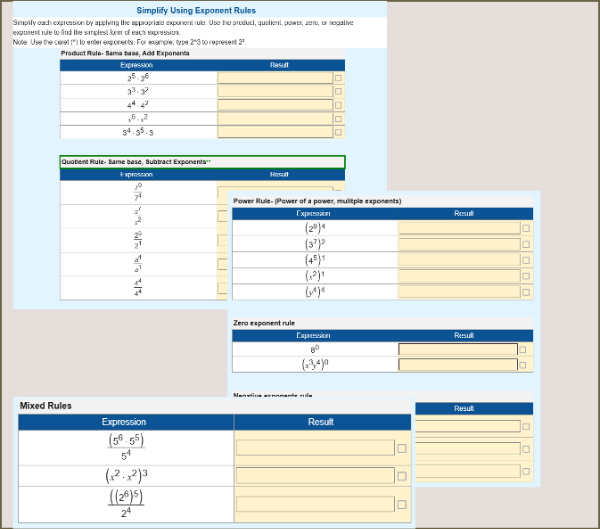
Practice simplifying expressions using the laws of exponents in this interactive worksheet. Students apply product, quotient, power, zero, and negative exponent rules to master exponent operations. Supports randomization so each student receives different exponents for individualized practice.
Grade Levels: [8]
Duration: 15 minutes
Topics: ["Scientific Notation"]
Standards: ["8.EE.A.1"]
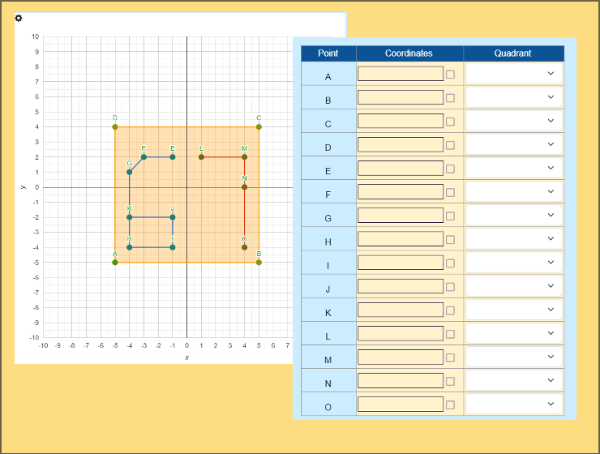
Practice coordinate graphing in all four quadrants with this fun mystery-picture activity! Students identify coordinates from labeled points, enter them into a table, and watch the graph reveal a hidden number. Reinforces quadrant recognition, positive/negative coordinates, and axis placement—perfect for 6th grade.
Grade Levels: [6,7]
Duration: 20 minutes
Topics: []
Standards: ["6.NS.C.6","6.NS.C.8","7.G.A.1"]
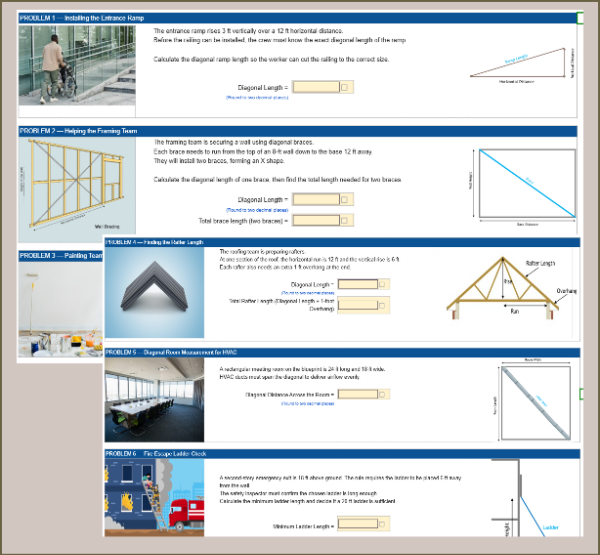
Help students apply the Pythagorean Theorem through real construction problems! From ramps and rafters to ladders and HVAC ducts, learners calculate diagonal distances and solve practical measurement tasks. Real-world visuals and auto-graded inputs make this an engaging 8th-grade geometry activity.
Grade Levels: [8]
Duration: 20 minutes
Topics: ["Pythagorean Theorem"]
Standards: ["8.G.B.7","8.G.B.8","8.G.B.6"]
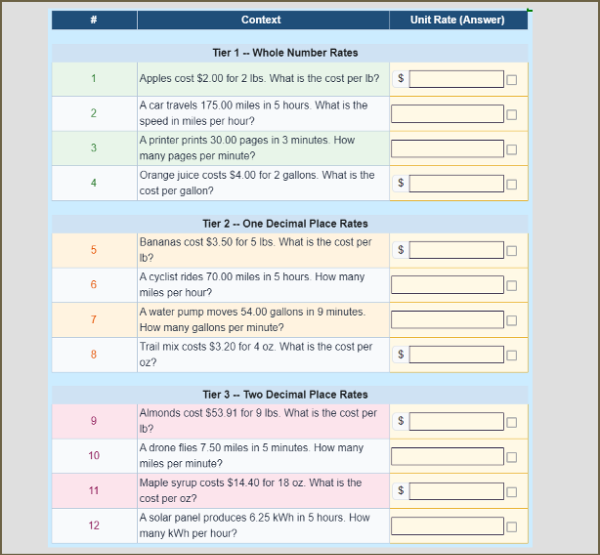
Interactive Grade 6 worksheet with 12 unit rate problems across three difficulty tiers — whole-number, one-decimal, and two-decimal rates — using real-world contexts like groceries and travel. Auto-graded with randomization.
Grade Levels: [6]
Duration: 20 minutes
Topics: ["Ratio","Unit Rate"]
Standards: ["6.RP.A.2","6.RP.A.3b","6.NS.B.3"]
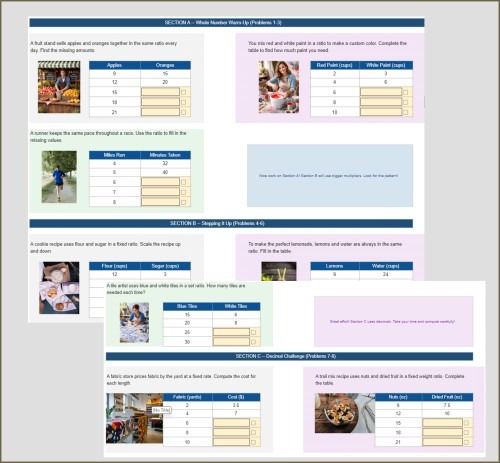
Interactive Grade 6 worksheet with 8 ratio table problems across three difficulty tiers — whole numbers, larger multipliers, and decimals. Students find missing values in two-column ratio tables using real-world contexts. Auto-graded with optional randomization.
Grade Levels: [6]
Duration: 20 minutes
Topics: ["Ratio","Ratio"]
Standards: ["6.RP.A.3","6.RP.A.3a","6.NS.B.3"]
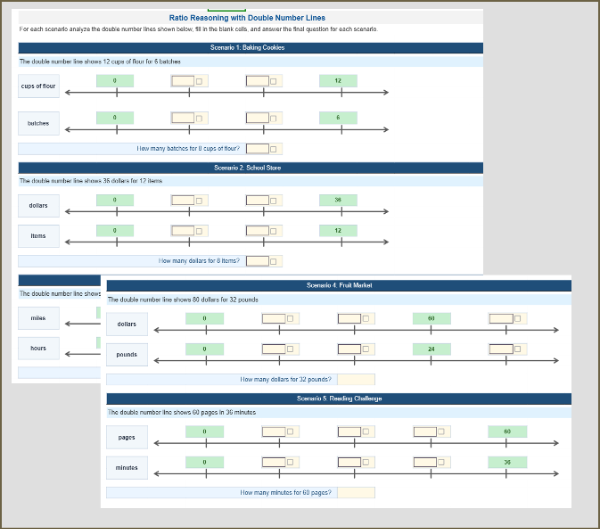
Interactive Grade 6 worksheet with 5 ratio scenarios where students complete double number lines and solve for unknown values across real-world contexts. Auto-graded with optional randomization.
Grade Levels: [6]
Duration: 25 minutes
Topics: ["Ratio","Ratio","Unit Rate","Proportional Relationships"]
Standards: ["6.RP.A.1","6.RP.A.3","6.NS.B.3"]
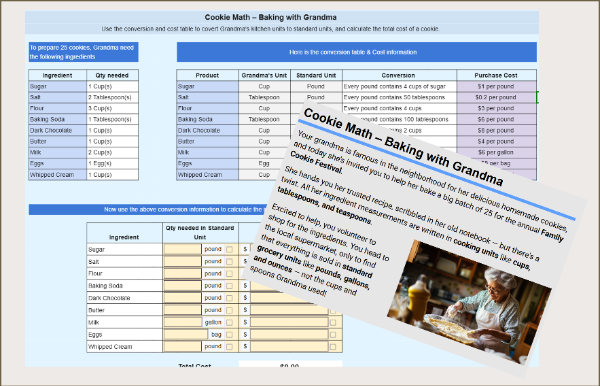
In this real-world math activity, students apply their understanding of ratios and fractions to convert Grandma’s recipe from kitchen units to standard grocery store units. Using a conversion chart and price list, they calculate the quantity and cost of each ingredient, determine the total expense for 25 cookies, and find the cost of one cookie.
Grade Levels: [7]
Duration: 15 minutes
Topics: ["Ratio","Negative Numbers"]
Standards: ["7.RP.A.1","7.RP.A.2","7.RP.A.2a","7.RP.A.2b","7.RP.A.2c","7.RP.A.2d","7.EE.B.3"]
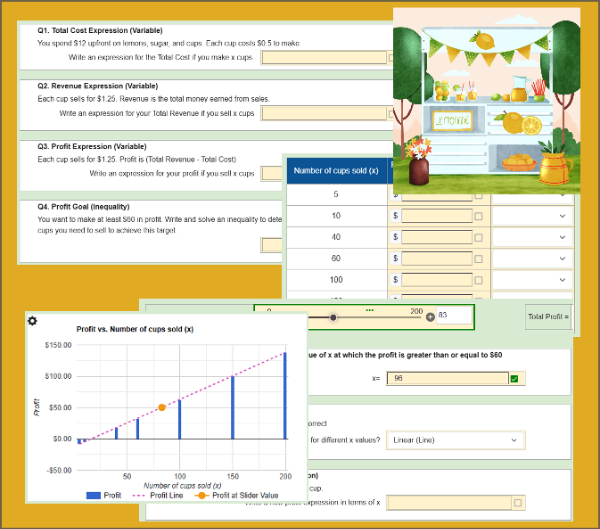
Help plan a lemonade stand by writing expressions for cost and profit, solving inequalities to reach a profit goal, and analyzing how the number of cups sold affects earnings. Students build a table, plot a linear graph, and use a slider to visualize how profit changes—making math both real and interactive!
Grade Levels: [6,7]
Duration: 20 minutes
Topics: ["Solving Equations","Solving Inequalities","Using Variables in Context","Linear Equations","Solving Linear Equations and Inequalities"]
Standards: ["7.EE.B.3","7.EE.B.4","7.EE.B.4a","6.EE.A.2","6.EE.B.6","6.EE.C.9"]
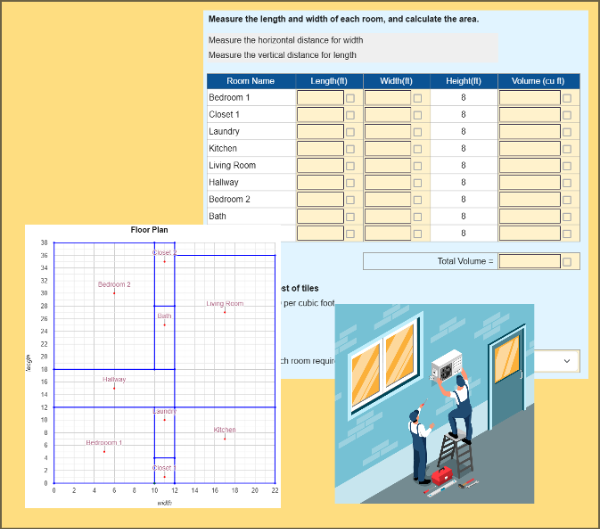
Students use a floor plan to calculate the volume of rooms by measuring dimensions and applying the formula for volume of rectangular prisms. They then estimate the HVAC cost, connecting geometry to real-world heating and cooling applications.
Grade Levels: [6,7]
Duration: 15 minutes
Topics: ["Scale Drawings","Area and Circumference","Volume and Surface Area"]
Standards: ["6.G.A.2","7.G.B.6"]
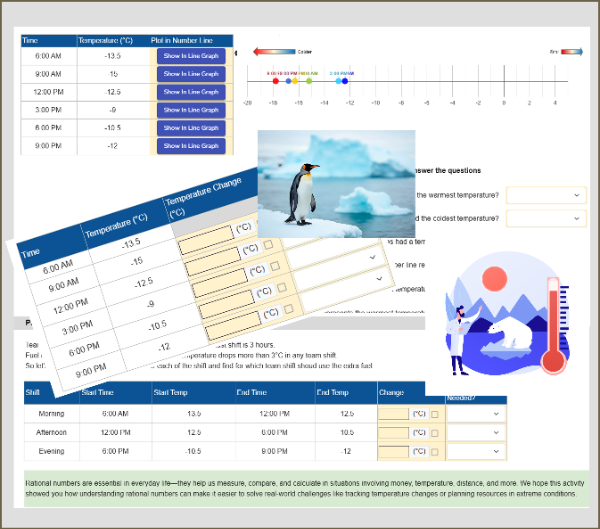
Track real-world temperature changes in Antarctica while learning how to add and subtract rational numbers. Students plot values on a number line, analyze patterns, and apply math to freezing-cold data!
Grade Levels: [7]
Duration: 20 minutes
Topics: ["Operations with Rational Numbers","Negative Numbers","Number Line Reasoning"]
Standards: ["7.NS.A.1","7.NS.A.1d","7.NS.A.3"]
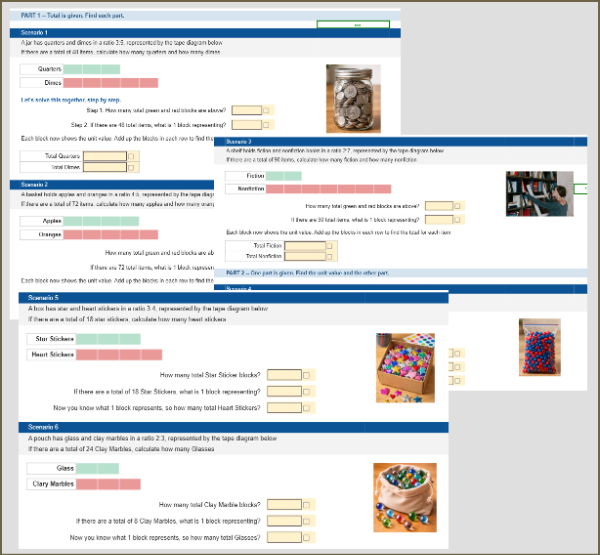
Interactive Grade 6 worksheet where students use tape diagrams to solve 6 ratio problems in real-world contexts - finding parts from totals and unknown parts from known parts. Auto-graded with randomization support.
Grade Levels: [6]
Duration: 20 minutes
Topics: ["Ratio","Ratio","Unit Rate"]
Standards: ["6.RP.A.3","6.RP.A.1"]
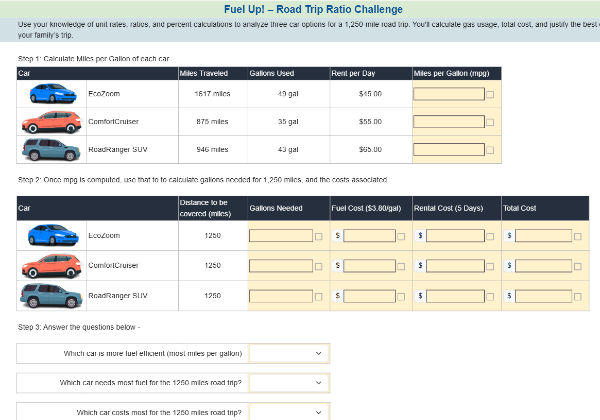
In this real-world math challenge, students use ratio and unit rate skills to plan a 1,250-mile road trip. They analyze past vehicle data, calculate miles per gallon, total costs, and compare options to choose the most cost-effective car.
Grade Levels: [7]
Duration: 20 minutes
Topics: ["Ratio","Unit Rate"]
Standards: ["7.RP.A.1","7.RP.A.2","7.RP.A.3","7.RP.A.2b"]
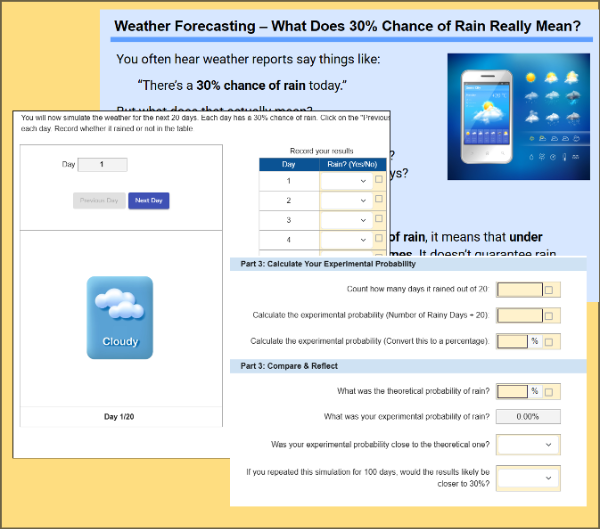
Students explore how theoretical probability applies to real-world weather forecasting by simulating 20 days of rain predictions. They compare their experimental results to the predicted 30% chance of rain and reflect on what probability really means.
Grade Levels: [7]
Duration: 15 minutes
Topics: ["Theoretical and Experimental Probability"]
Standards: ["7.SP.C.5","7.SP.C.6","7.SP.C.7a"]
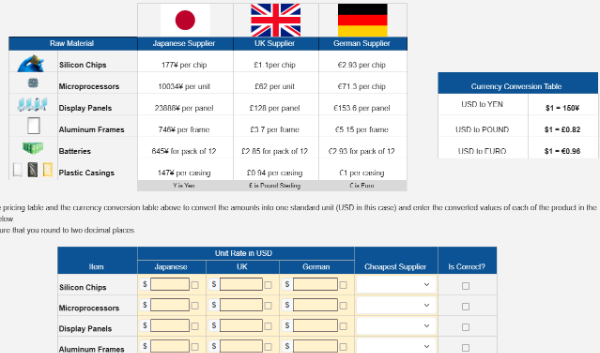
Students act as the CEO of a company, to find the cheapest country to purchase the raw materials, students will do unit conversion between different currencies.
Grade Levels: [6,7]
Duration: 20 minutes
Topics: ["Ratio","Unit Rate","Operations with Rational Numbers","Negative Numbers"]
Standards: ["6.RP.A.1","6.RP.A.2","6.NS.B.3","7.RP.A.1","7.RP.A.2","7.NS.A.3","7.EE.B.3"]

In this community kitchen budgeting activity, students convert recipe quantities and calculate the cost of each ingredient needed to prepare a holiday-style meal. Includes turkey, mashed potatoes, gravy, carrots, peas, cranberry sauce, and more.
Grade Levels: [7,8]
Duration: 20 minutes
Topics: ["Ratio","Unit Rate","Proportional Relationships","Operations with Rational Numbers","Negative Numbers"]
Standards: ["7.RP.A.1","7.RP.A.2","7.EE.B.3"]

Students will analyze five different data sets, each representing a real-life scenario such as weekly attendance or pages read by students. Their task is to calculate the mean, median, mode, range, and interquartile range for each data set, helping them develop essential skills in statistical analysis.
Grade Levels: [7]
Duration: 20 minutes
Topics: ["Random Samples","Measures of Center and Spread","Interpreting Data"]
Standards: ["6.SP.B.5","6.SP.B.5a","6.SP.B.5c","7.SP.B.3","7.SP.B.4"]
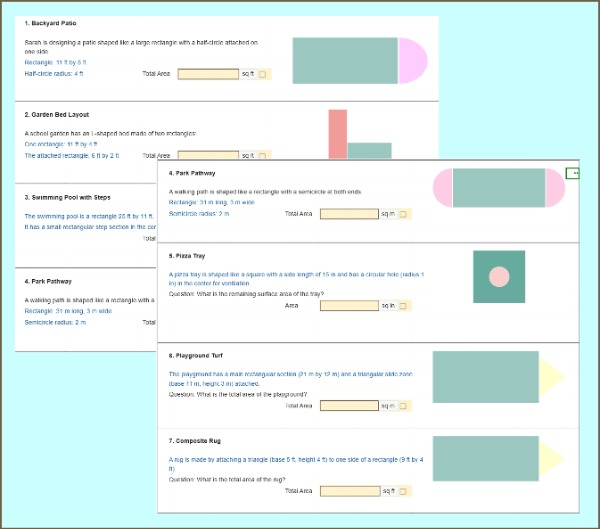
Calculate the area of composite figures using real-world scenarios like patios, pools, and pathways. Students break down each shape into rectangles, triangles, or circles, apply formulas, and find total area by adding or subtracting. A fun, practical way to apply geometry skills and deepen understanding of area concepts.
Grade Levels: [7]
Duration: 15 minutes
Topics: ["Area and Circumference"]
Standards: ["7.G.B.6"]
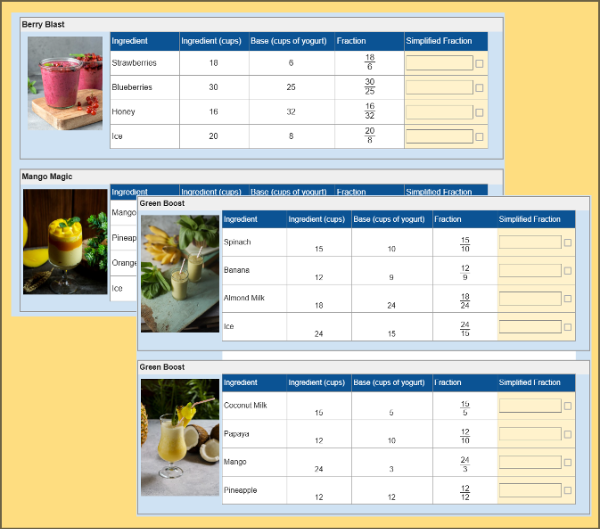
Step into the Smoothie Shop and simplify real-world recipe ratios! Students practice reducing fractions to lowest terms using the greatest common factor (GCF). Perfect for introducing or reviewing simplifying fractions through a fun, food-based context.
Grade Levels: [6,8]
Duration: 20 minutes
Topics: ["Ratio","Operations with Rational Numbers"]
Standards: ["6.NS.B.4","8.NS.A.1","6.RP.A.1"]
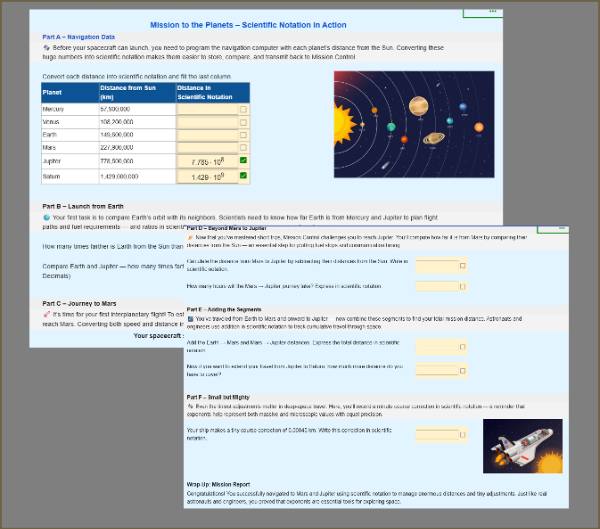
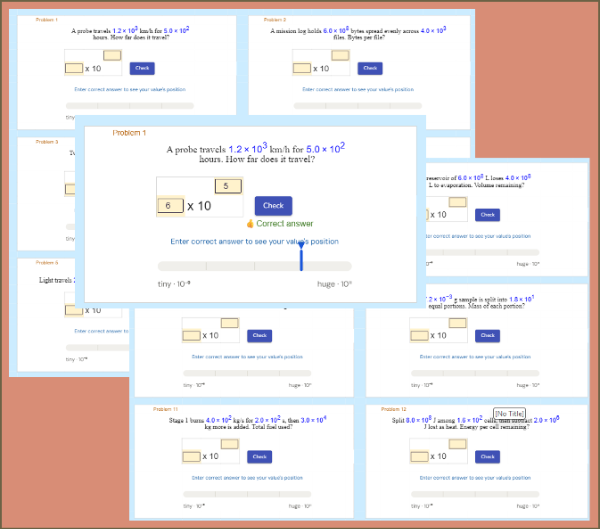
Blast off on a math mission through the solar system! In this interactive worksheet, students use scientific notation to calculate and compare planetary distances, travel times, and orbits. A fun, story-driven way to understand why scientists use exponential form to work with extremely large and small numbers.
Grade Levels: [8]
Duration: 30 minutes
Topics: ["Scientific Notation"]
Standards: ["8.EE.A.3","8.EE.A.4"]
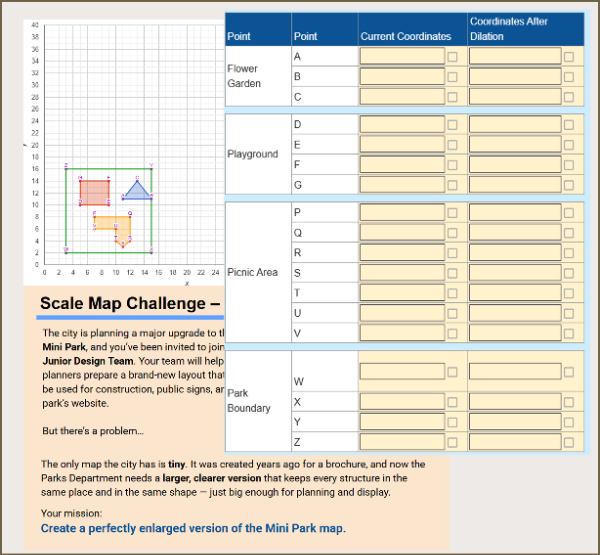
Dilate a Mini Park on the coordinate plane using a scale factor of 2! Students apply the rule (x, y) → (2x, 2y) to enlarge multiple park structures and watch the scaled map appear as they enter correct coordinates. A hands-on way to explore similarity, scale factors, and dilations in 8th-grade geometry.
Grade Levels: [8]
Duration: 15 minutes
Topics: ["Scale Drawings","Transformations","Congruence and Similarity"]
Standards: ["8.G.A.3"]
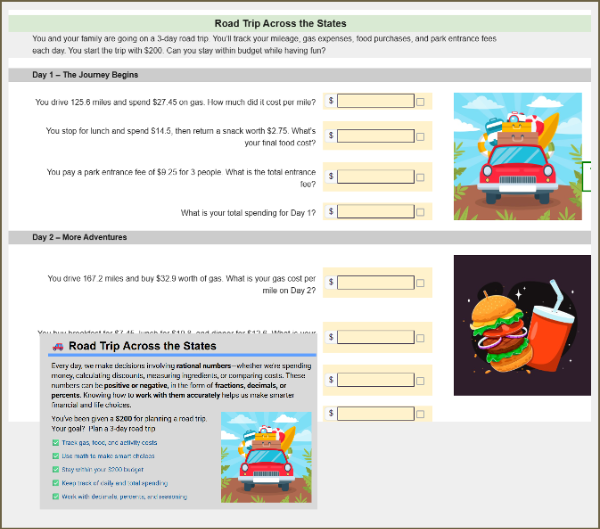
Track your budget on a 3-day road trip by calculating gas costs, food expenses, and entrance fees. Students solve multi-step problems using decimals and precents to stay within a $200 budget.
Grade Levels: [7]
Duration: 15 minutes
Topics: ["Ratio","Unit Rate","Percent Problems","Multi-Step Ratio Problems"]
Standards: ["7.EE.B.3"]
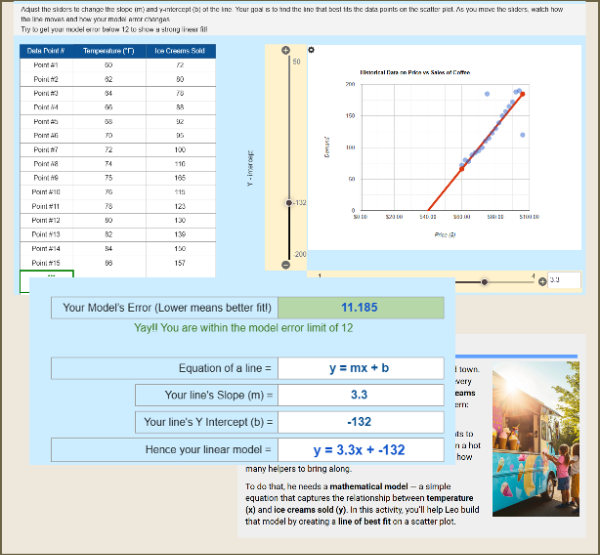
Students help Leo, an ice cream truck owner, build a linear model to predict sales! Using interactive sliders to adjust slope and intercept, they create the best-fit line, minimize model error, and discover how straight lines can model real-world data relationships.
Grade Levels: [8]
Duration: 15 minutes
Topics: ["Scatter Plots","Trend Lines","Bivariate Data Analysis"]
Standards: ["8.SP.A.2"]
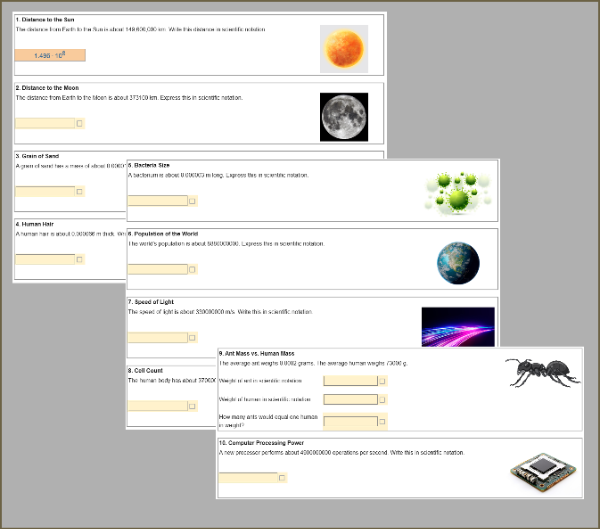
Explore real-world measurements from the cosmos to the microscopic world while learning how to write large and small numbers in scientific notation. Students convert quantities into exponential form to make data easier to read, compare, and compute—building confidence with powers of ten and place value understanding.
Grade Levels: [8]
Duration: 15 minutes
Topics: ["Scientific Notation"]
Standards: ["8.EE.A.3","8.EE.A.4"]
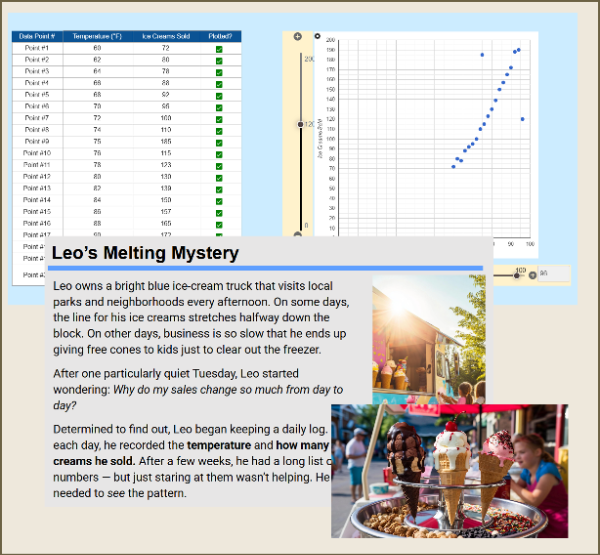
Help Leo, an ice cream truck owner, uncover how weather affects his sales! Students plot real data points to create a scatter plot, identify trends, and spot outliers. This engaging, hands-on activity builds understanding of correlation, trend lines, and data interpretation using a fun, real-world scenario.
Grade Levels: [8]
Duration: 20 minutes
Topics: ["Random Samples","Scatter Plots"]
Standards: ["8.SP.A.1","8.SP.A.2"]
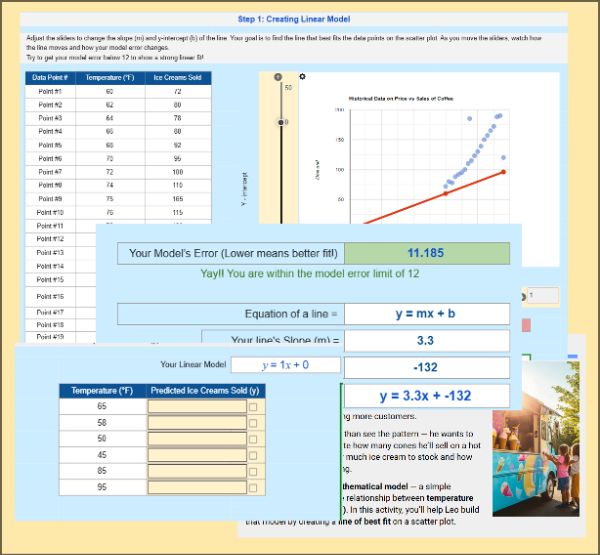
Students help Leo, an ice cream truck owner, analyze sales data by creating and using a linear model. Using sliders to adjust slope and intercept, they minimize model error, find the best-fit line, and predict sales for new temperatures—discovering how data models are built and used in the real world.
Grade Levels: [8]
Duration: 20 minutes
Topics: ["Random Samples","Probability Models","Scatter Plots","Bivariate Data Analysis","Interpreting Data"]
Standards: ["8.SP.A.3","8.SP.A.2"]
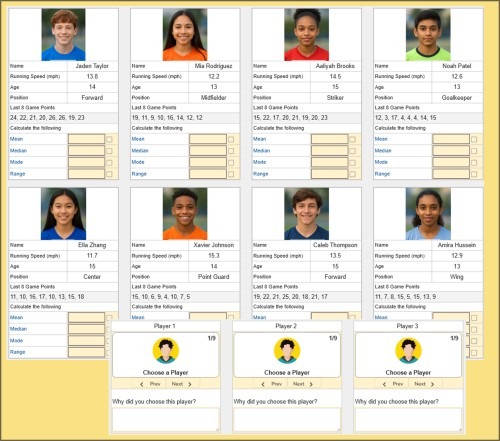
In this engaging worksheet, students analyze 8 sports players using real-world data. They calculate mean, median, mode, and range of game stats, then select the best 3 players for their dream team. A fun way to apply statistics in decision-making!
Grade Levels: [7]
Duration: 20 minutes
Topics: ["Comparing Populations","Measures of Center and Spread","Interpreting Data"]
Standards: ["7.SP.B.3","7.SP.B.4"]
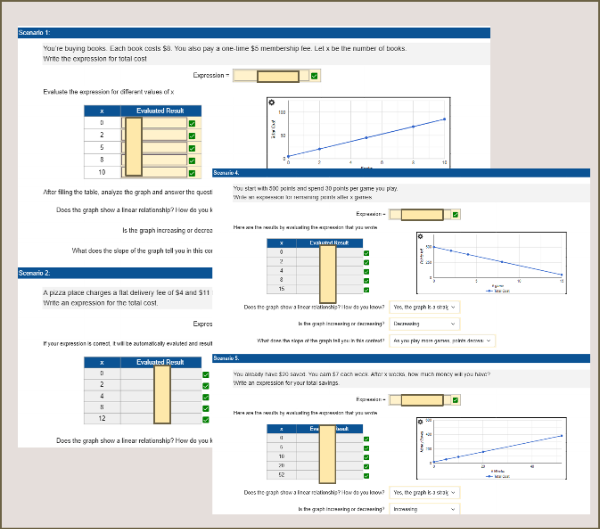
In this skill-building worksheet, students practice writing algebraic expressions from real-world scenarios using variables. They also analyze graphs to interpret the relationships and understand how cost or quantity changes.
Grade Levels: [7]
Duration: 20 minutes
Topics: ["Using Variables in Context","Linear Equations"]
Standards: ["7.EE.B.4a","7.EE.A.1","7.EE.A.2"]
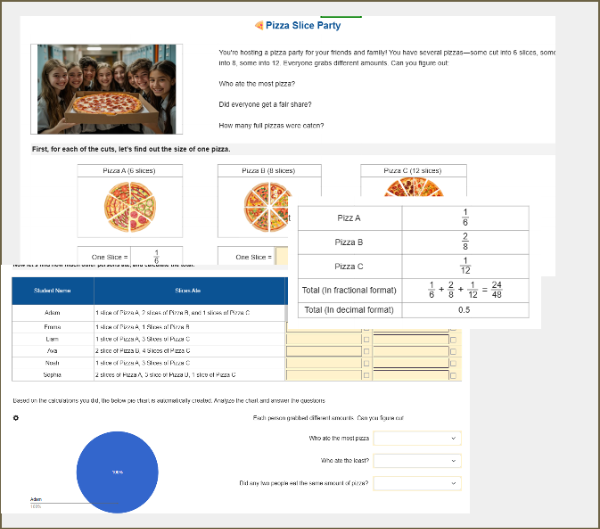
A fun and visual worksheet where students calculate how much pizza each person ate using fractions and decimals. Perfect for practicing proportional reasoning, comparisons, and data interpretation with minimal text and maximum engagement.
Grade Levels: [7]
Duration: 15 minutes
Topics: ["Ratio","Proportional Relationships","Operations with Rational Numbers","Negative Numbers"]
Standards: ["7.RP.A.3","7.NS.A.2d","7.SP.C.5","7.SP.C.8"]
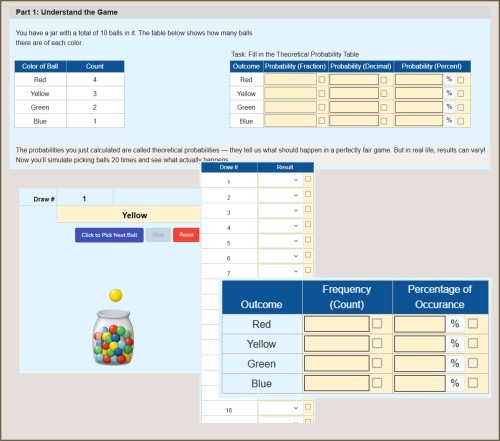
Explore probability through a fun ball-drawing simulation! Students calculate theoretical probabilities, simulate 20 draws from a colored ball jar, record outcomes, and compare results to expected values. A hands-on activity that builds intuition around chance, fairness, and real-world variability.
Grade Levels: [7]
Duration: 20 minutes
Topics: ["Random Samples","Probability Models","Theoretical and Experimental Probability"]
Standards: ["7.SP.C.5","7.SP.C.6"]
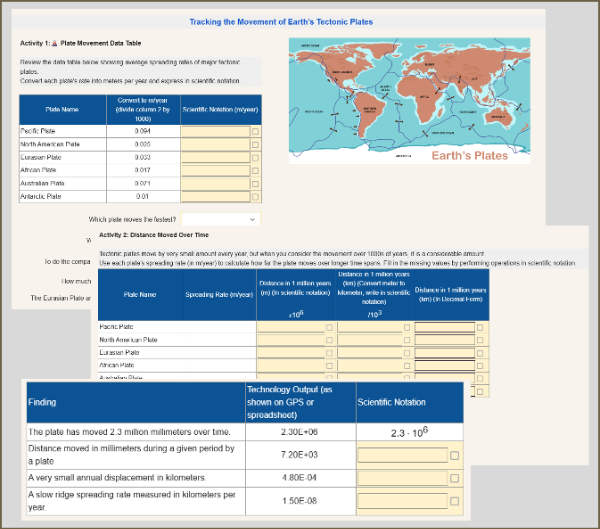
Explore how scientists use scientific notation to measure the slow motion of Earth’s tectonic plates. Students convert plate movement data, calculate long-term distances, and interpret technology-generated outputs like E-notation — learning how exponential form makes real-world measurements easier to compare and understand.
Grade Levels: [8]
Duration: 20 minutes
Topics: ["Scientific Notation"]
Standards: ["8.EE.A.4"]
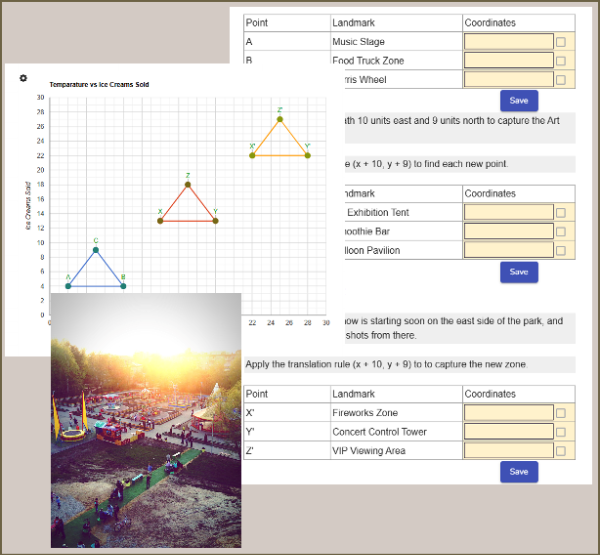
Students take control of a drone mapping a city festival to learn how translations work! They plot the drone’s flight path, move it to new coordinates, and verify that the triangles remain congruent after each translation. Through two real-world missions, students discover that translations slide shapes without changing their size, angles, or orientation—making them perfect examples of rigid motion.
Grade Levels: [8]
Duration: 20 minutes
Topics: ["Transformations","Congruence and Similarity"]
Standards: ["8.G.A.1","8.G.A.1a"]
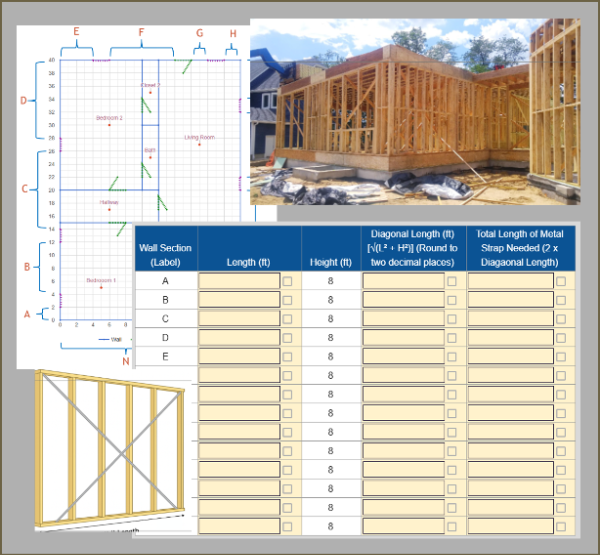
Estimate metal strap bracing for a house by analyzing a floor plan and using the Pythagorean Theorem. Students measure exterior wall lengths, calculate diagonal brace lengths, and compute total material needed. A hands-on, real-world construction task that strengthens geometry and problem-solving skills.
Grade Levels: [8]
Duration: 30 minutes
Topics: ["Pythagorean Theorem"]
Standards: ["8.G.B.7"]
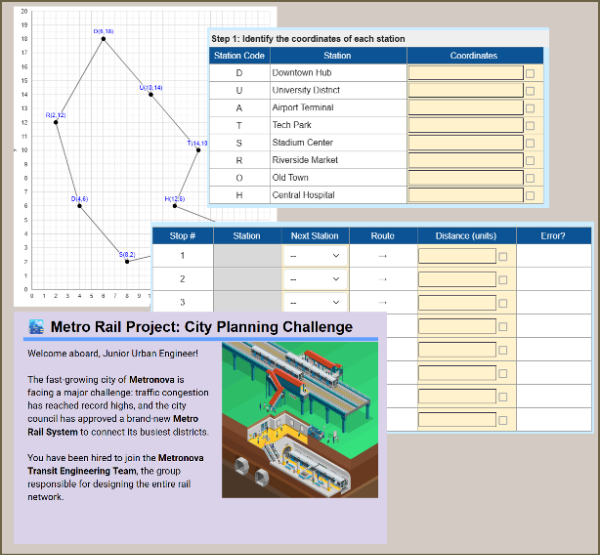
Design a metro rail system by calculating distances between stations using the Pythagorean Theorem. Identify coordinates, build a travel route, estimate total rail length and construction cost, and justify your proposal. With optional randomization, each student receives unique station coordinates.
Grade Levels: [8]
Duration: 20 minutes
Topics: ["Scale Drawings","Pythagorean Theorem"]
Standards: ["8.G.B.8"]
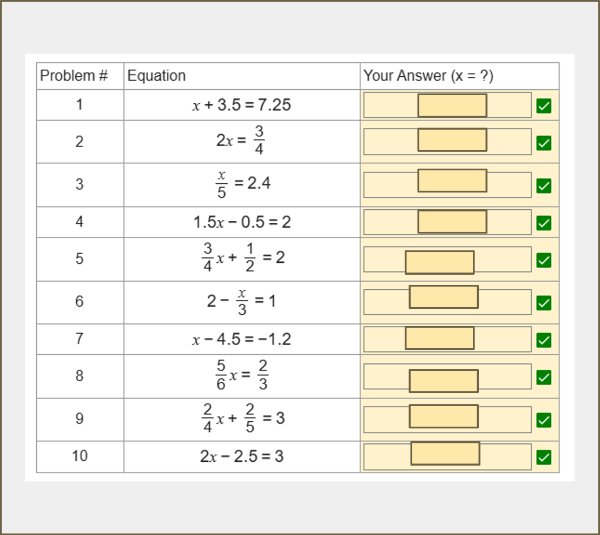
Practice solving one- and two-step equations with rational numbers, including fractions and decimals. Students can enter answers in either decimal or fraction form.
Grade Levels: [7]
Duration: 15 minutes
Topics: ["Solving Equations","Linear Equations","Solving Linear Equations and Inequalities"]
Standards: ["7.EE.B.4a","7.EE.A.1"]
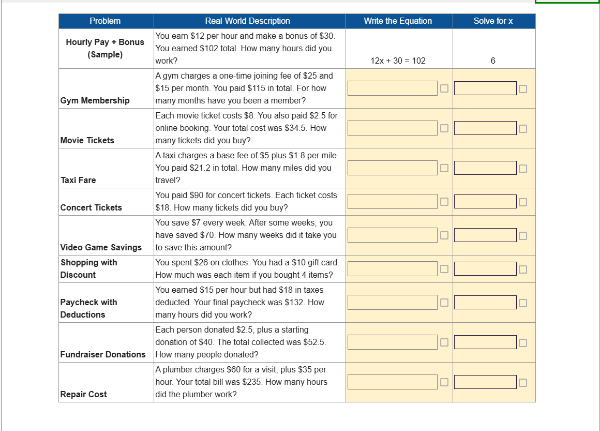
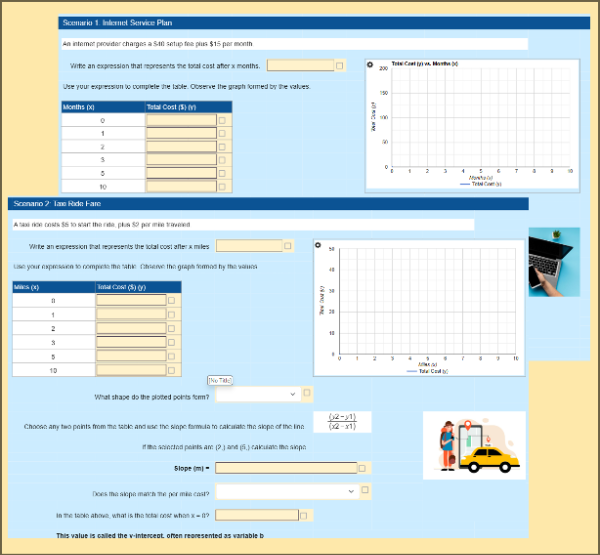
Practice solving real-world problems using one-step and two-step equations with rational numbers. Students write and solve equations based on scenarios like taxi fares, savings, and ticket purchases—perfect for building equation fluency.
Grade Levels: [7]
Duration: 20 minutes
Topics: ["Solving Equations","Using Variables in Context","Solving Linear Equations and Inequalities"]
Standards: ["7.EE.B.3","7.EE.B.4a"]
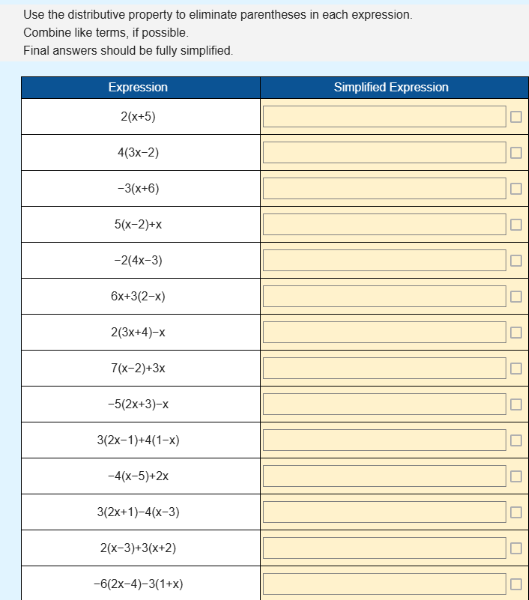
Practice simplifying algebraic expressions using the distributive property. Students expand expressions, combine like terms, and write the final simplified form. Perfect for building fluency with integer operations and expression simplification.
Grade Levels: [7]
Duration: 10 minutes
Topics: ["Solving Equations"]
Standards: ["7.EE.A.1"]
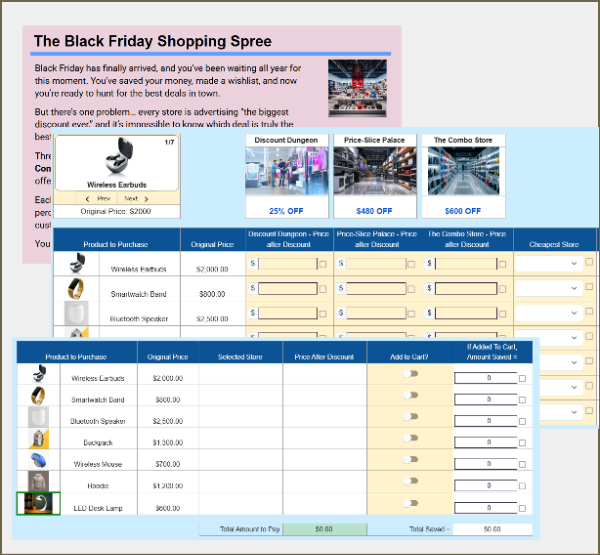
A fun, Black Friday–themed math activity where students calculate discounts, compare store prices, choose the best deals, and create a budget-friendly shopping cart. Perfect for teaching real-world percent applications and smart spending skills.
Grade Levels: [7,8]
Duration: 20 minutes
Topics: ["Percent Problems","Negative Numbers"]
Standards: ["7.RP.A.3"]
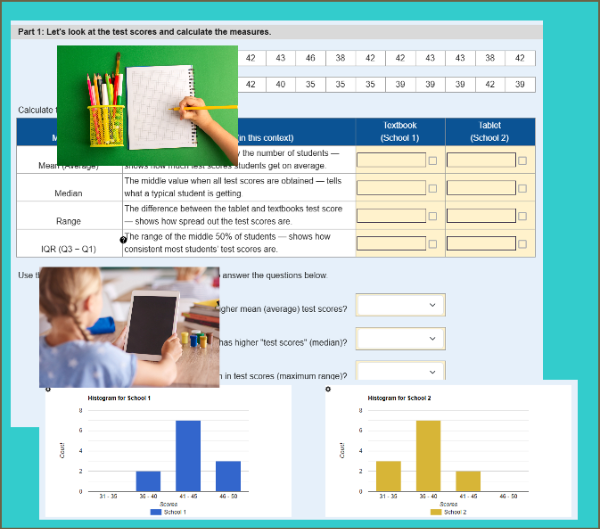
Students analyze test score data from two schools — one using tablets, the other using textbooks — to calculate mean, median, range, and IQR. They compare the distributions using numerical measures and histograms to draw conclusions about student performance.
Grade Levels: [7]
Duration: 15 minutes
Topics: ["Random Samples","Comparing Populations","Interpreting Data"]
Standards: ["7.SP.B.3","7.SP.B.4"]
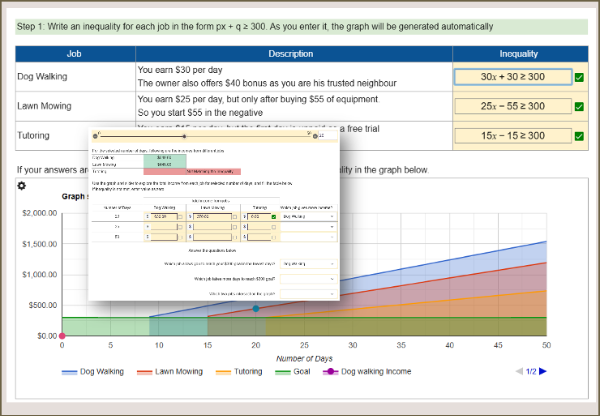
Students write and solve inequalities representing real-world side jobs, then analyze automatically generated graphs to compare job outcomes and make decisions based on visual and numerical insights.
Grade Levels: [7]
Duration: 20 minutes
Topics: ["Solving Inequalities","Using Variables in Context","Solving Linear Equations and Inequalities","Interpreting Data","Linear Functions"]
Standards: ["7.EE.B.4","7.EE.B.4b"]
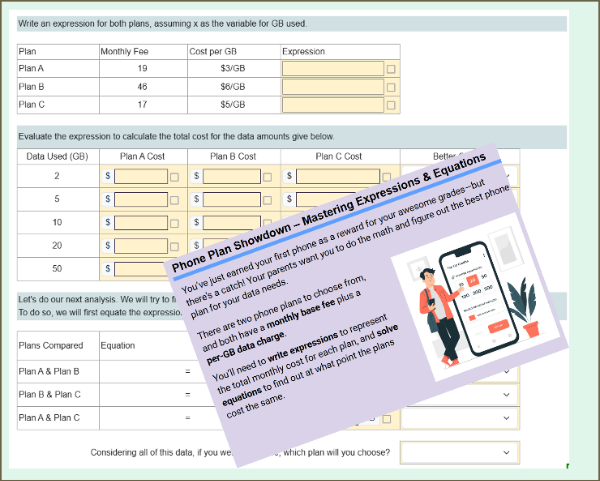
Students compare three different phone plans by writing algebraic expressions to model their monthly cost. They evaluate these expressions for different data usage amounts and determine at what point one plan becomes more economical than the others.
Grade Levels: [6,7]
Duration: 15 minutes
Topics: ["Equivalent Expressions","Solving Equations","Using Variables in Context","Linear Equations"]
Standards: ["7.EE.A.1","7.EE.A.2","7.EE.B.3","7.EE.B.4a","6.EE.A.2","6.EE.B.7"]
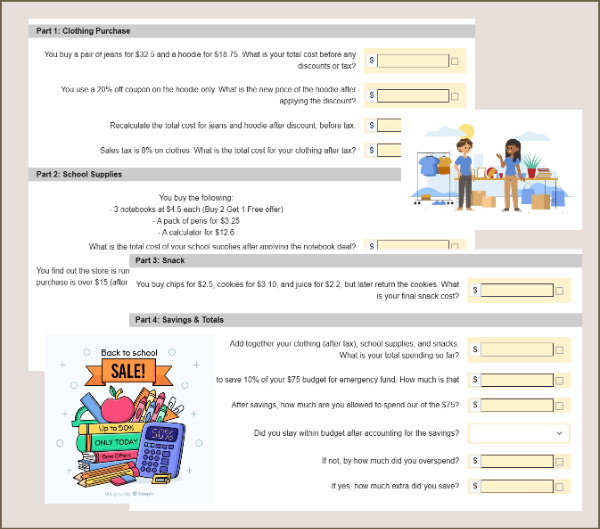
A real-world budgeting challenge where students apply rational number operations—decimals, fractions, and percentages—to stay within a $75 back-to-school budget.
Grade Levels: [7]
Duration: 15 minutes
Topics: ["Percent Problems","Multi-Step Ratio Problems","Operations with Rational Numbers","Negative Numbers"]
Standards: ["7.EE.B.3","7.RP.A.3","7.NS.A.3","6.NS.B.3"]
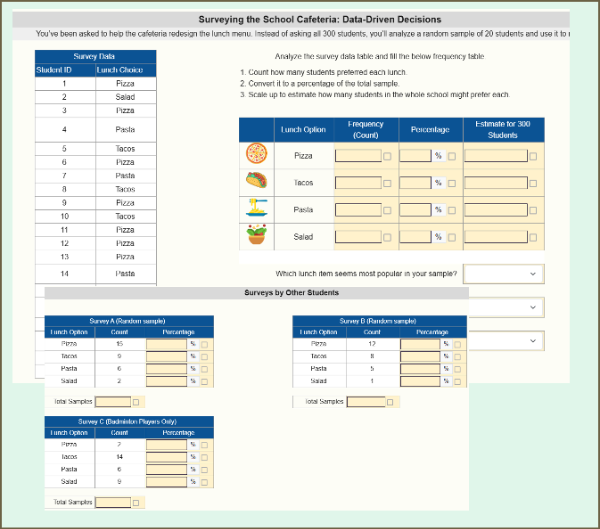
Students analyze a random sample of lunch preferences to estimate the most popular food choices in their school. They compare results from multiple surveys—including a biased one—to understand the importance of sample size and randomness in drawing reliable conclusions.
Grade Levels: [7]
Duration: 20 minutes
Topics: ["Random Samples","Comparing Populations","Interpreting Data"]
Standards: ["7.SP.A.1","7.SP.A.2"]
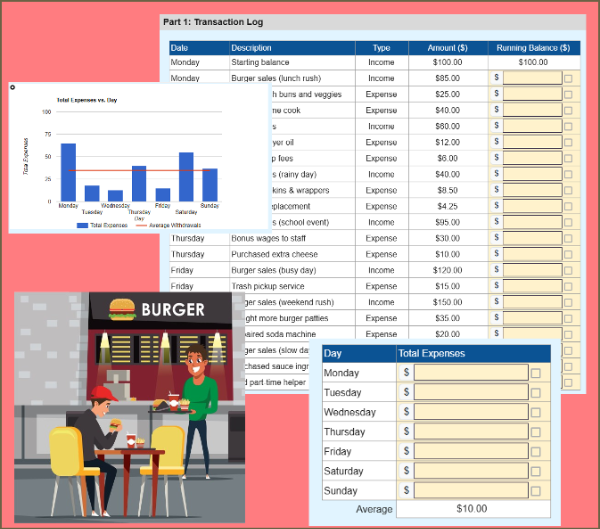
Students take on the role of a restaurant’s financial manager, tracking income and expenses, calculating a running balance, and analyzing spending patterns using rational number addition and subtraction and using graphs.
Grade Levels: [7]
Duration: 20 minutes
Topics: ["Operations with Rational Numbers","Negative Numbers"]
Standards: ["7.NS.A.1","7.NS.A.3"]
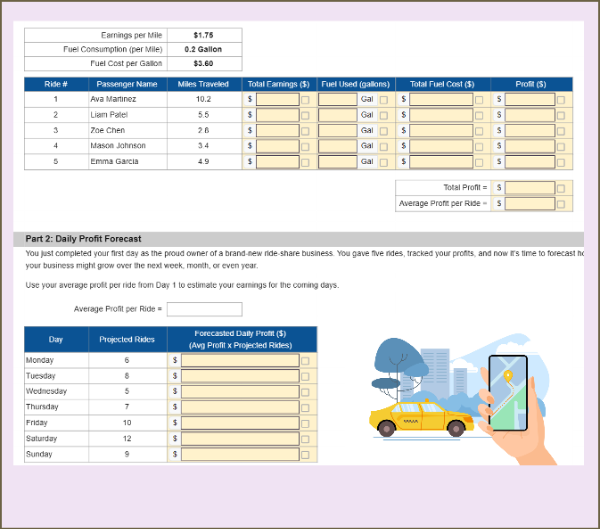
Students run a ride-share business, calculating profits using multiplication and division of rational numbers. They analyze real-world costs, earnings, and forecast long-term success using math.
Grade Levels: [6,7]
Duration: 15 minutes
Topics: ["Operations with Rational Numbers","Negative Numbers"]
Standards: ["7.NS.A.2","7.NS.A.3"]

This worksheet is designed to help students practice using ratio tables to solve real-world problems. Each problem provides a scenario and a partially filled ratio table. Students need to use the ratio table to find missing values and solve the problems.
Grade Levels: [6,7]
Duration: 15 minutes
Topics: ["Ratio","Ratio","Proportional Relationships"]
Standards: ["6.RP.A.3a","6.RP.A.3"]
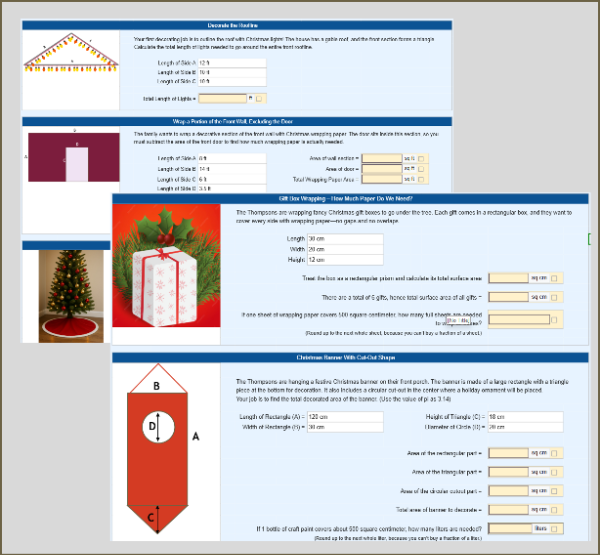
Celebrate the holidays with this real-world geometry challenge! Students calculate perimeter, area, and surface area as they decorate a roofline with lights, wrap a wall, design a tree skirt, wrap gift boxes, and paint a festive banner. Perfect for practicing 7th-grade geometry with a fun Christmas theme!
Grade Levels: [7]
Duration: 20 minutes
Topics: ["Area and Circumference","Volume and Surface Area"]
Standards: ["7.G.B.4","7.G.B.6"]
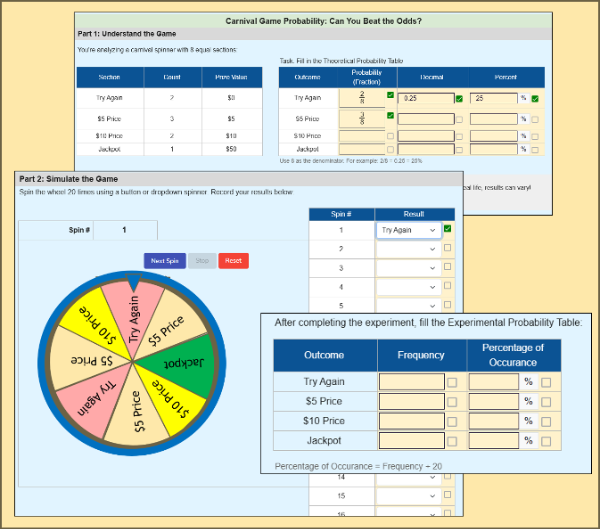
Students explore probability through a carnival spinner game. They calculate theoretical probabilities, run a 20-spin simulation, and compare theoretical and experimental probabilities. This worksheet supports randomization — each student gets unique outcomes on every spin.
Grade Levels: [7]
Duration: 20 minutes
Topics: ["Theoretical and Experimental Probability"]
Standards: ["7.SP.C.5","7.SP.C.6","7.SP.C.7","7.SP.C.7a","7.SP.C.7b"]
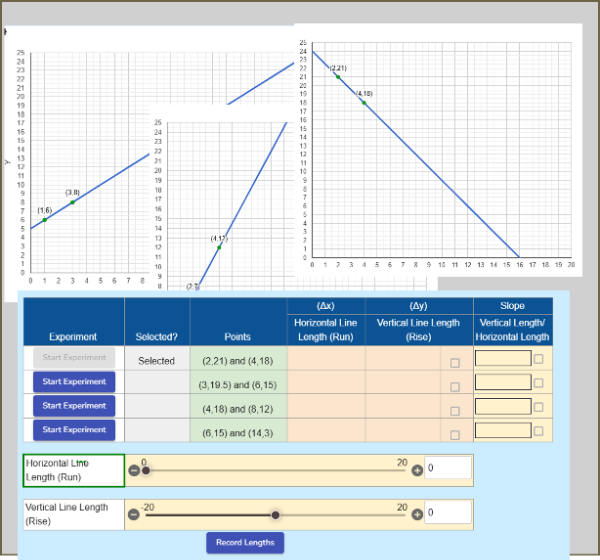
Explore slope through hands-on experiments! Students use sliders to measure rise (Δy) and run (Δx) between two points, calculate slope, and compare lines with positive and negative slopes. A visual, interactive way to understand steepness, direction, and why slope stays constant on a linear graph.
Grade Levels: [8]
Duration: 20 minutes
Topics: ["Linear Equations"]
Standards: ["8.EE.B.6"]
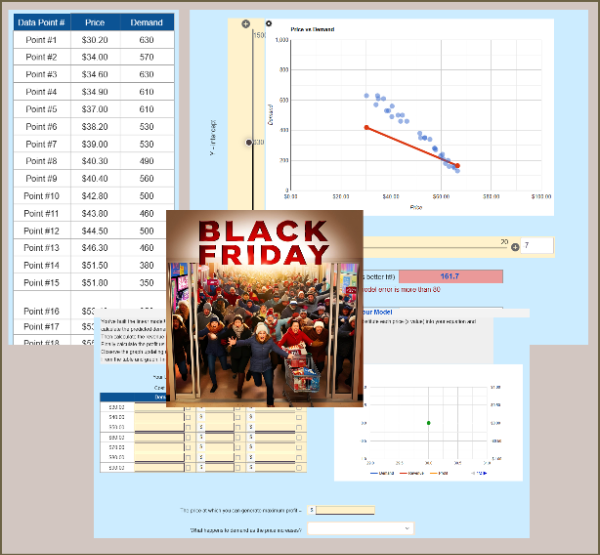
Students build a linear model from a price–demand scatterplot, then use it to predict demand, revenue, and profit at different price points. They analyze curves and determine the price that maximizes profit. A perfect real-world 8th-grade activity for scatterplots, linear modeling, and financial reasoning.
Grade Levels: [8]
Duration: 20 minutes
Topics: ["Random Samples","Scatter Plots","Interpreting Data"]
Standards: ["8.SP.A.2","8.SP.A.3"]
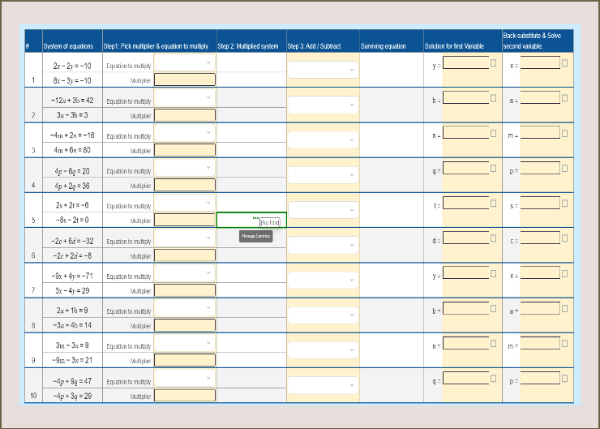
Build 8th grade fluency with solving systems of equations by elimination. This interactive, auto-graded worksheet guides students through picking a multiplier, aligning coefficients, adding or subtracting to eliminate a variable, and back-substituting. Ten problems with varied variables and instant feedback. Aligned to Common Core 8.EE.C.8b. Randomization supported to prevent answer copying.
Grade Levels: [8]
Duration: 20 minutes
Topics: ["Solving Equations","Systems of Equations"]
Standards: ["8.EE.C.8b"]
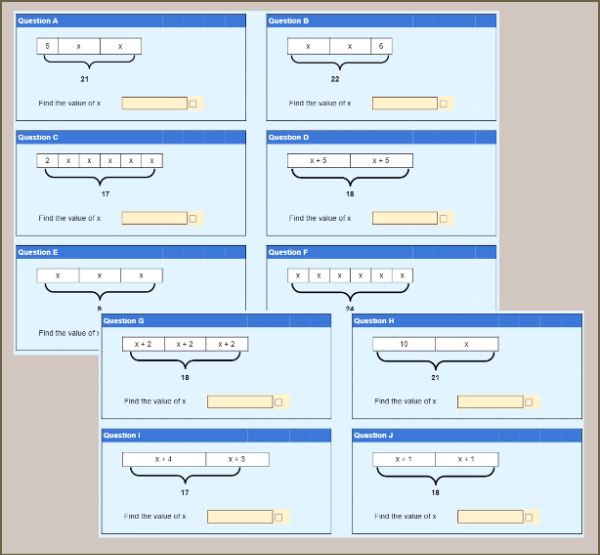
Help students build algebra skills using visual tape diagrams. In this worksheet, learners solve one-step equations by identifying equal parts, understanding variable relationships, and finding the value of x. A great introduction to algebraic thinking for 6th grade and early 7th grade.
Grade Levels: [6,7]
Duration: 15 minutes
Topics: ["Solving Equations","Linear Equations","Solving Linear Equations and Inequalities"]
Standards: ["6.EE.B.7","6.EE.A.2","6.EE.B.5"]
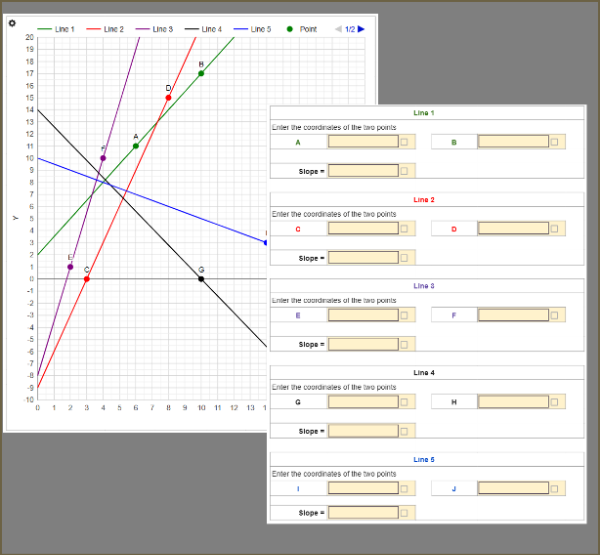
Help students master slope using real graphs. In this interactive worksheet, learners identify coordinates, apply the slope formula, and compare slopes of multiple lines. Supports randomization so each student receives different lines and points, making it perfect for 8th-grade slope practice.
Grade Levels: [8]
Duration: 20 minutes
Topics: ["Solving Equations","Linear Equations"]
Standards: ["8.EE.B.5"]
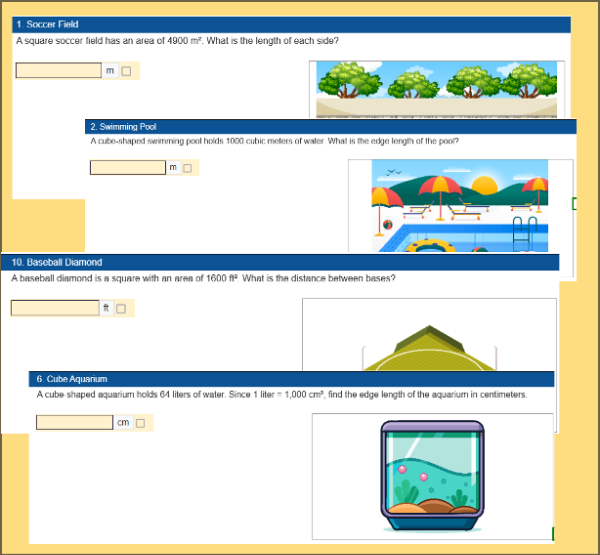
Help students master square roots and cube roots with real-world problems involving areas of squares and volumes of cubes. Learners solve equations like x² = p and x³ = p to find missing dimensions. Supports randomization so each student receives unique problems and answers.
Grade Levels: [8]
Duration: 20 minutes
Topics: ["Completing the Square"]
Standards: ["8.EE.A.2"]

Help students understand real-world data with this 8th-grade scatter plot activity. Learners compare a data table to three scatter plots, identify associations, clusters, and outliers, and discover why scatter plots make patterns easier to see. A perfect introduction to bivariate data and the 8.SP standards.
Grade Levels: [8]
Duration: 20 minutes
Topics: ["Random Samples","Scatter Plots","Bivariate Data Analysis"]
Standards: ["8.SP.A.1"]
Help students understand linear relationships through real-world scenarios. In this worksheet, learners write expressions, complete tables, analyze graphs, and identify slope as the unit rate and the y-intercept as the starting value. A strong conceptual bridge leading to the equation y = mx + b.
Grade Levels: [8]
Duration: 20 minutes
Topics: ["Proportional Relationships","Linear Equations"]
Standards: ["8.EE.B.5"]
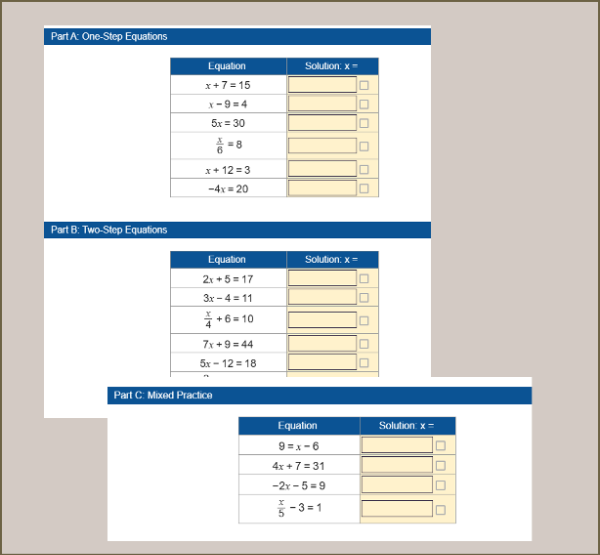
Solve one-step and two-step linear equations with instant feedback. This interactive worksheet helps students practice isolating variables, applying inverse operations, and checking solutions. Includes mixed practice and supports randomization so every student gets unique equations. Perfect for Grade 7–8 algebra practice and reinforcement.
Grade Levels: [8]
Duration: 20 minutes
Topics: ["Solving Equations","Linear Equations"]
Standards:
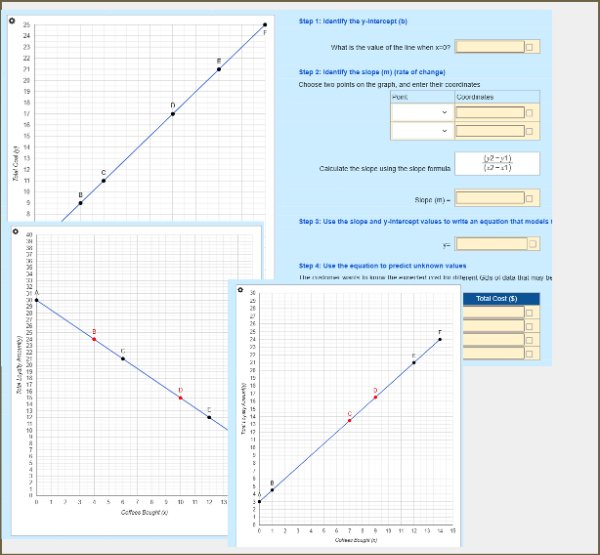
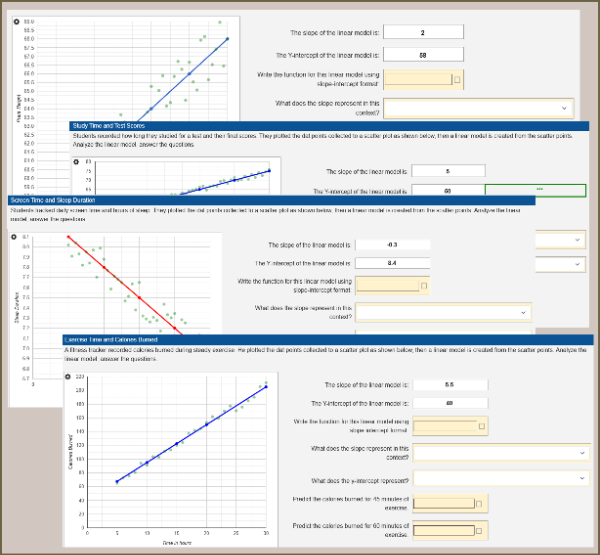
Students explore real-world linear relationships by analyzing graphs, identifying slope and y-intercept, and writing equations in slope-intercept form. Using real data from everyday scenarios, they model situations, create equations, and predict unknown values. Ideal for building conceptual understanding of y=mx+b.
Grade Levels: [8]
Duration: 20 minutes
Topics: ["Solving Equations","Using Variables in Context","Linear Equations"]
Standards: ["8.EE.B.5","8.EE.B.6","8.EE.C.7","8.F.A.3"]
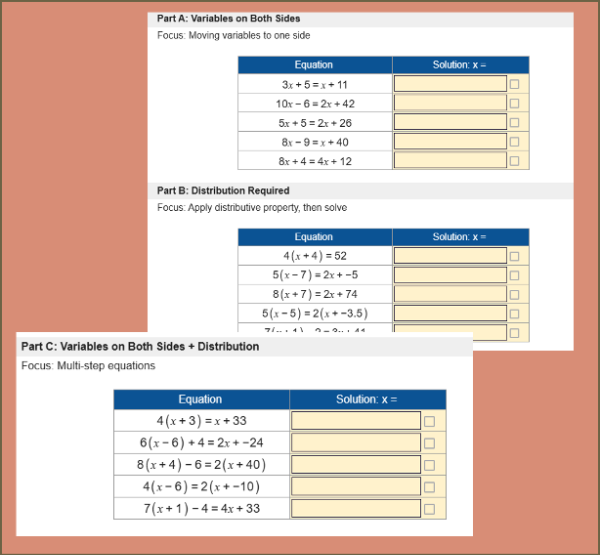
Practice solving linear equations with variables on both sides. Students use distribution, combine like terms, and isolate the variable in this auto-graded worksheet. Supports randomization so every student receives unique equations. Ideal for Grade 8 algebra practice aligned to CCSS 8.EE.C.7.
Grade Levels: [8]
Duration: 20 minutes
Topics: ["Equivalent Expressions","Solving Equations","Linear Equations","Systems of Equations"]
Standards: ["8.EE.C.7","8.EE.C.7a","8.EE.C.7b"]
Apply algebra to real life with this interactive worksheet on solving linear equations. Students write and solve equations from real-world scenarios, interpret solutions, and identify special cases like no solution or infinite solutions. Supports randomization so every student receives unique problems. Aligned to Grade 8 standard 8.EE.C.7.
Grade Levels: [8]
Duration: 15 minutes
Topics: ["Solving Equations","Using Variables in Context","Linear Equations"]
Standards: ["8.EE.C.7","8.EE.C.7b","8.EE.C.7a"]
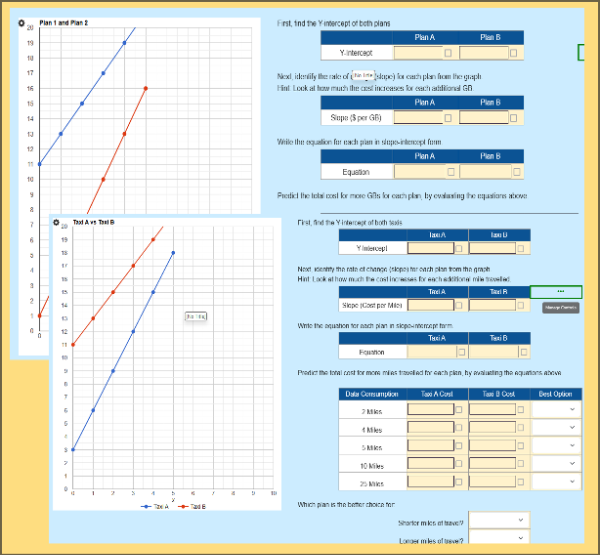
Students compare real-world linear models by analyzing graphs, identifying slope and y-intercept, writing equations in slope-intercept form, and predicting values. Through an internet plan comparison, learners use equations to determine the better option for low and high usage, building strong conceptual understanding of linear relationships.
Grade Levels: [8]
Duration: 20 minutes
Topics: ["Solving Equations","Using Variables in Context","Linear Equations"]
Standards: ["8.EE.B.6","8.EE.B.5","8.F.A.3"]
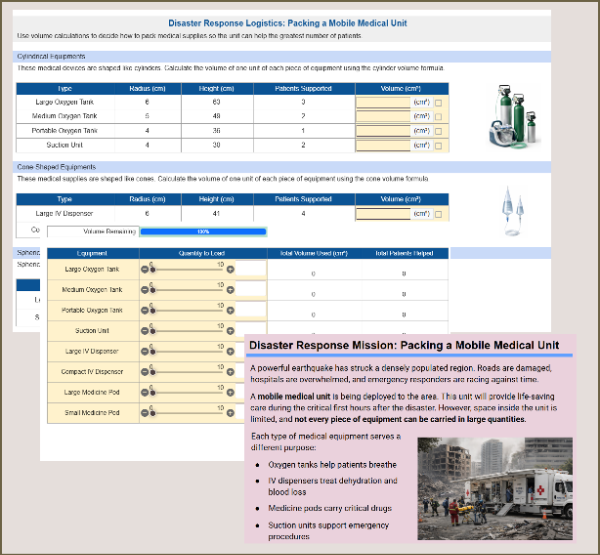
Pack a mobile medical unit in this interactive real-world math challenge. Students calculate volumes of cylinders, cones, and spheres, then use sliders to choose equipment quantities that help at least 100 patients while staying within storage limits. A powerful application of CCSS 8.G.C.9 focused on decision making and optimization.
Grade Levels: [8]
Duration: 20 minutes
Topics: ["Volume and Surface Area","Volume of Cylinders, Cones, and Spheres"]
Standards: ["8.G.C.9"]
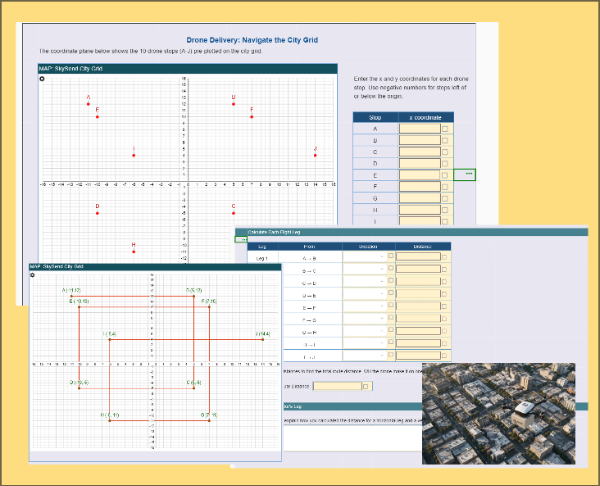
Interactive Grade 6 worksheet where students act as junior drone navigators for SkySend, reading coordinates of 10 city stops and calculating leg distances along a rectilinear route. Auto-graded with randomization support.
Grade Levels: [6]
Duration: 20 minutes
Topics: ["Negative Numbers","Number Line Reasoning","Interpreting Graphs"]
Standards: ["6.NS.C.8","6.NS.C.6"]
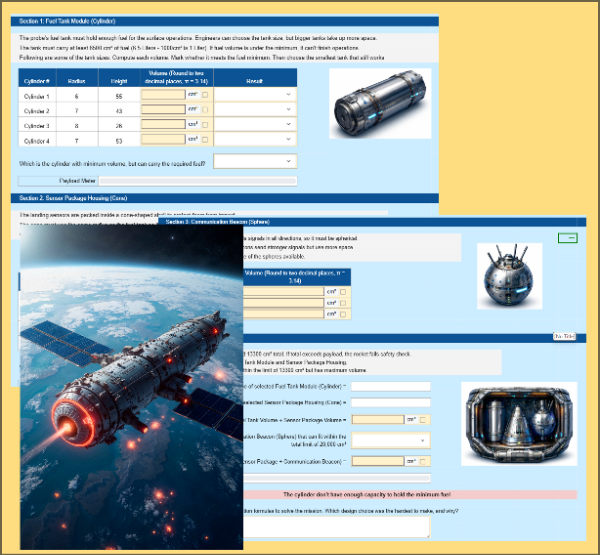
Design and launch a deep space probe in this interactive real-world math challenge. Students calculate and compare volumes of cylinders, cones, and spheres to meet fuel, sensor, and payload constraints. Using realistic engineering decisions and auto-graded inputs, learners apply 8.G.C.9 concepts while optimizing space and making mission-critical choices.
Grade Levels: [8]
Duration: 20 minutes
Topics: ["Volume and Surface Area","Volume of Cylinders, Cones, and Spheres"]
Standards: ["8.G.C.9"]
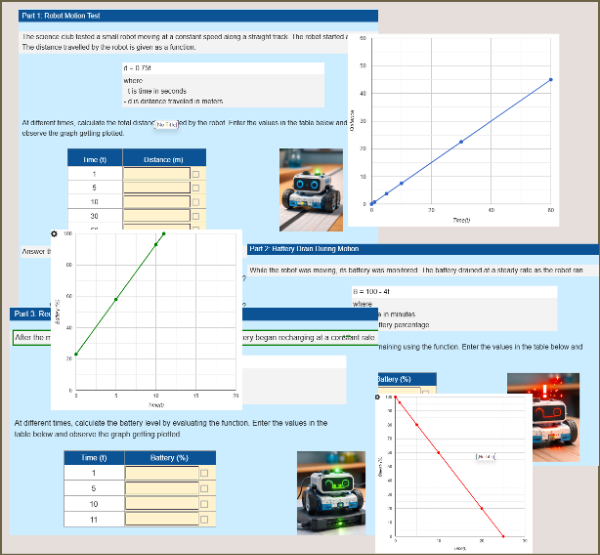
Analyze real physics experiments using linear functions in this interactive worksheet. Students graph given functions for robot motion, battery drain, and battery charging, then interpret slopes and intercepts in context. Aligned to CCSS 8.F.A.1, this activity builds strong intuition for functions through meaningful graphs and real-world data.
Grade Levels: [8]
Duration: 20 minutes
Topics: ["Solving Equations","Linear Equations","Function Concepts","Linear Functions"]
Standards: ["8.F.A.1","8.EE.C.7"]
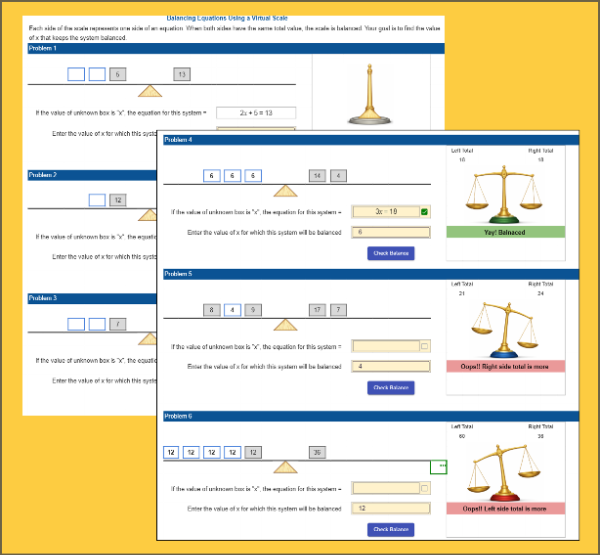
Help students understand equations using a virtual balance scale. In this interactive Grade 7 worksheet, students model equations, write expressions, and solve for x by keeping both sides balanced. Features visual feedback, auto-checking, and randomized problems for independent learning.
Grade Levels: [7]
Duration: 20 minutes
Topics: ["Solving Equations","Using Variables in Context","Linear Equations"]
Standards: ["7.EE.B.4"]
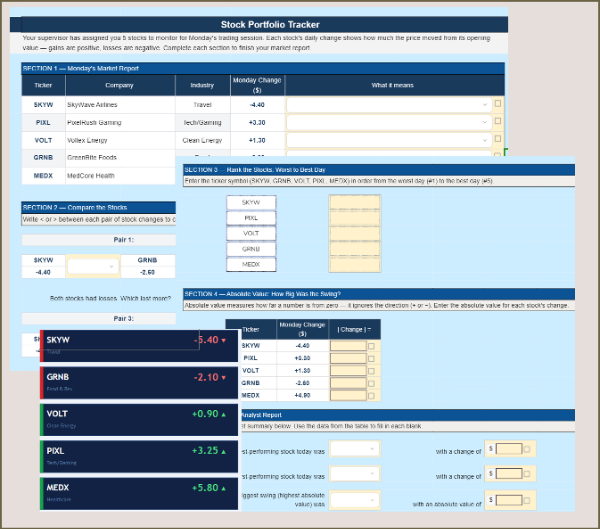
Grade 6 interactive worksheet where students act as junior stock analysts, interpreting signed number changes, writing inequalities, calculating absolute values, and completing a structured analyst report. Auto-graded with randomized stock data.
Grade Levels: [6]
Duration: 20 minutes
Topics: ["Negative Numbers","Negative Numbers"]
Standards: ["6.NS.C.7c","6.NS.C.7d","6.NS.C.7b","6.NS.C.7a"]
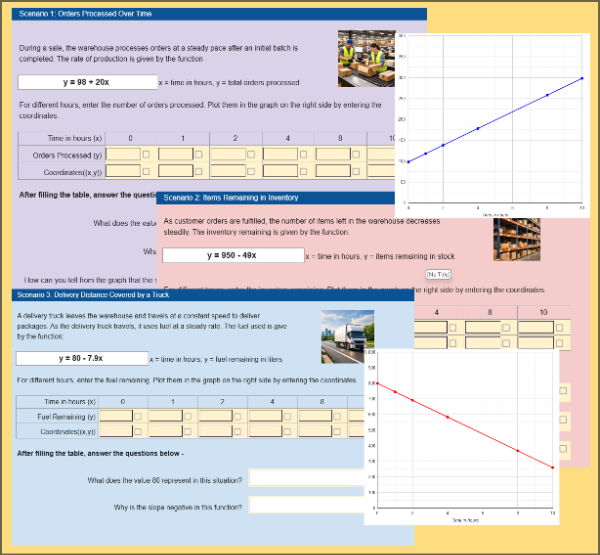
Analyze real-world warehouse operations by graphing given linear functions in this interactive worksheet. Students create tables, plot ordered pairs, and interpret slopes and y-intercepts for orders processed, inventory remaining, and fuel usage. Aligned to CCSS 8.F.A.1, this activity builds strong graphing and function interpretation skills through a realistic e-commerce storyline.
Grade Levels: [8]
Duration: 20 minutes
Topics: ["Using Variables in Context","Linear Equations","Systems of Equations"]
Standards: ["8.F.A.1"]
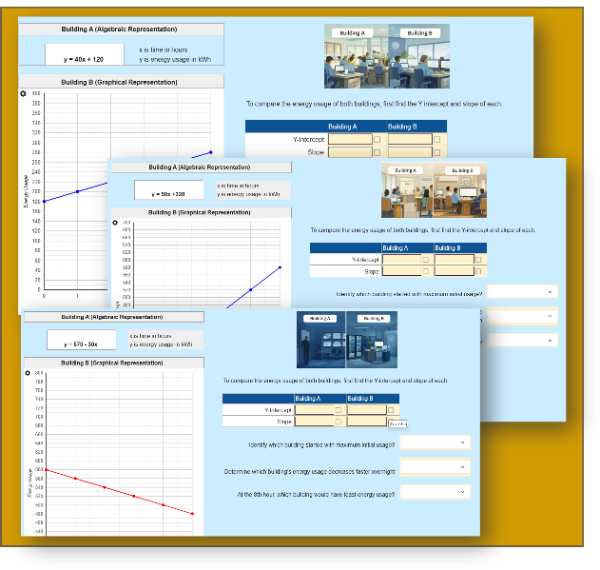
Students compare two linear functions represented in algebraic and graphical form to determine which changes faster. Using real-world energy usage scenarios, students identify slopes and y-intercepts, interpret positive and negative rates of change, and justify comparisons. Aligned to CCSS 8.F.A.2 and ideal for practice or assessment.
Grade Levels: [8]
Duration: 20 minutes
Topics: ["Solving Equations","Using Variables in Context","Linear Equations"]
Standards: ["8.F.A.2"]
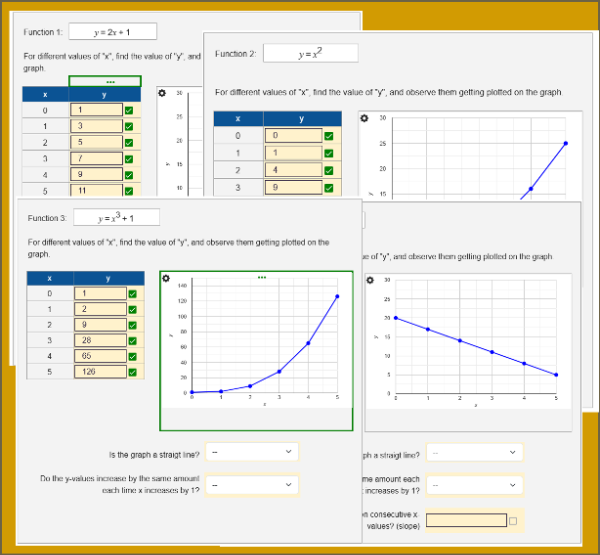
Students explore linear and non-linear functions by completing tables, observing graphs, and analyzing equations. They identify straight-line graphs, constant rates of change, and the structure of y=mx+b, then explain why other functions are not linear. Aligned to CCSS 8.F.A.3 and ideal for practice or assessment.
Grade Levels: [8]
Duration: 20 minutes
Topics: ["Solving Equations","Linear Equations","Solving Quadratic Equations"]
Standards: ["8.F.A.3"]
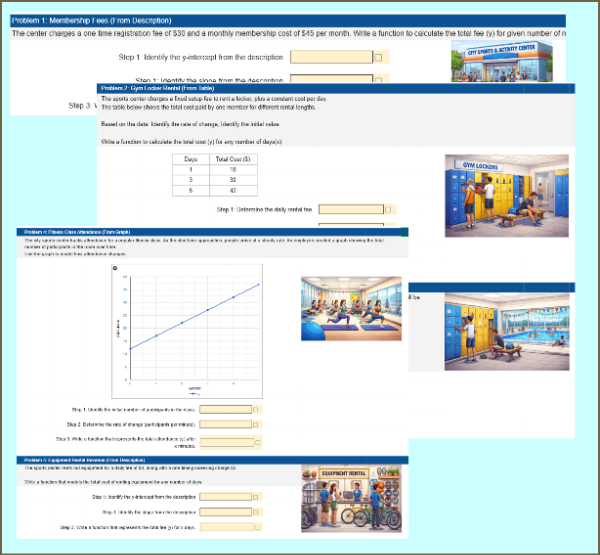
Students construct linear functions to model real-world situations at a city sports and activity center. Using descriptions, tables, graphs, and data points, they identify rates of change and initial values, write equations in the form y = mx + b, and interpret slope and intercept in context. Aligned to CCSS 8.F.B.4 and ideal for practice or assessment.
Grade Levels: [8]
Duration: 20 minutes
Topics: ["Using Variables in Context","Linear Equations"]
Standards: ["8.F.B.4"]
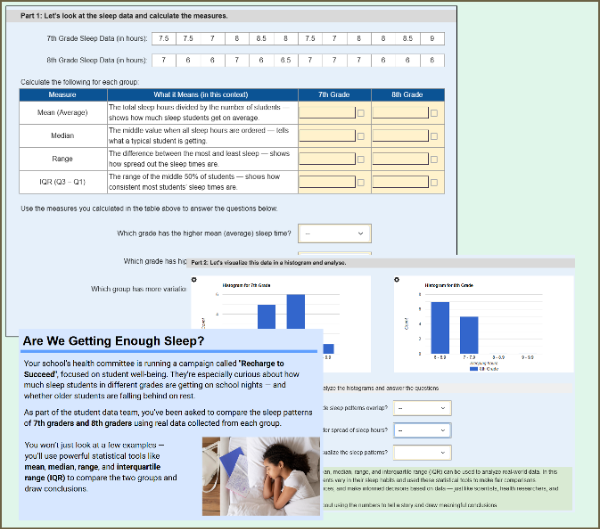
Students compare the sleep patterns of 7th and 8th graders using real-world data. They calculate mean, median, range, and IQR, then interpret histograms and make informal inferences about group differences. This worksheet supports randomization, so each student may receive different sleep data.
Grade Levels: [7,8]
Duration: 15 minutes
Topics: ["Comparing Populations","Interpreting Data"]
Standards: ["7.SP.B.3","7.SP.B.4","8.SP.A.1"]
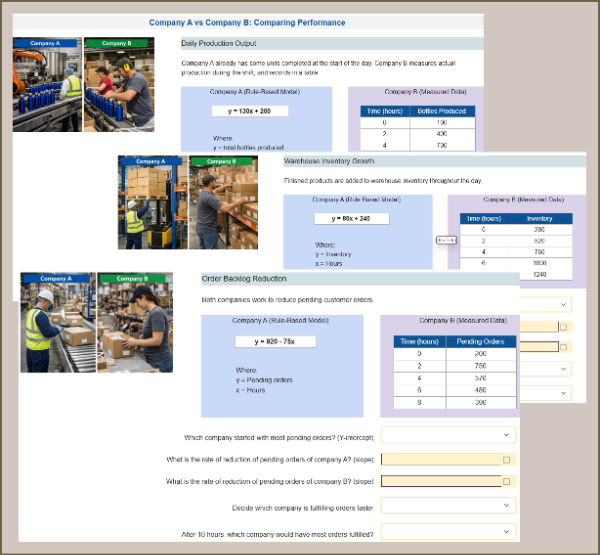
Students compare two linear functions represented in different forms: one as an algebraic equation and the other as a table of values. Using real-world company operations like production, inventory, and order fulfillment, students identify slopes and intercepts to determine which function changes faster and justify their reasoning.
Grade Levels: [8]
Duration: 20 minutes
Topics: ["Linear Equations","Solving Linear Equations and Inequalities"]
Standards: ["8.F.A.2"]
Students analyze real-world scatterplots and linear models to interpret bivariate data. They write equations using given slopes and y-intercepts, explain what these values mean in context, make predictions, and evaluate model limitations. Aligned to CCSS 8.SP.A.3 and ideal for statistics practice or assessment.
Grade Levels: [8]
Duration: 20 minutes
Topics: ["Linear Equations","Scatter Plots","Trend Lines","Bivariate Data Analysis","Interpreting Data"]
Standards: ["8.SP.A.3"]
Students analyze real-world two-way frequency tables to explore possible associations between categorical variables. They calculate and compare relative frequencies, interpret patterns, and justify conclusions using data. Aligned to CCSS 8.SP.A.4, this worksheet builds core statistical reasoning skills and works well for practice, assessment, or independent learning.
Grade Levels: [8]
Duration: 20 minutes
Topics: ["Comparing Populations","Bivariate Data Analysis","Interpreting Data"]
Standards: ["8.SP.A.4"]
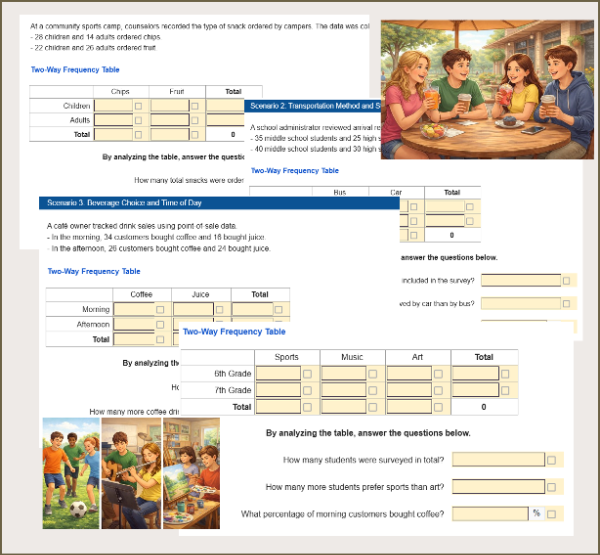
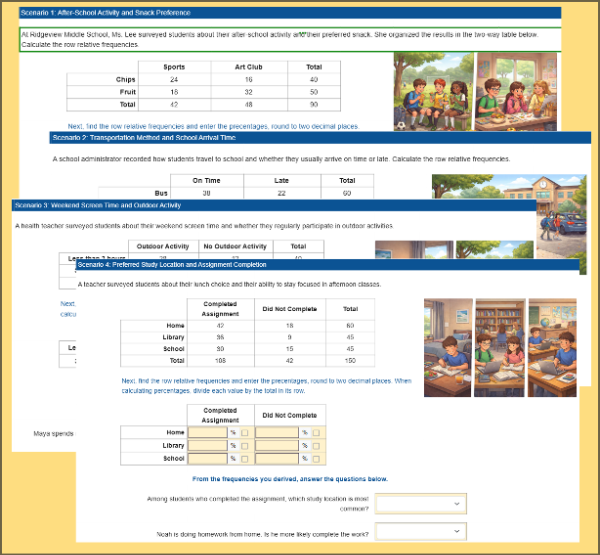
Help students explore real-world data using two-way frequency tables. In this interactive worksheet, students calculate relative frequencies, analyze categorical data, and identify possible associations across engaging scenarios like activities, snacks, screen time, and study habits. Aligned to Grade 8 Statistics standards.
Grade Levels: [8]
Duration: 20 minutes
Topics: ["Bivariate Data Analysis","Interpreting Data"]
Standards: ["8.SP.A.4"]
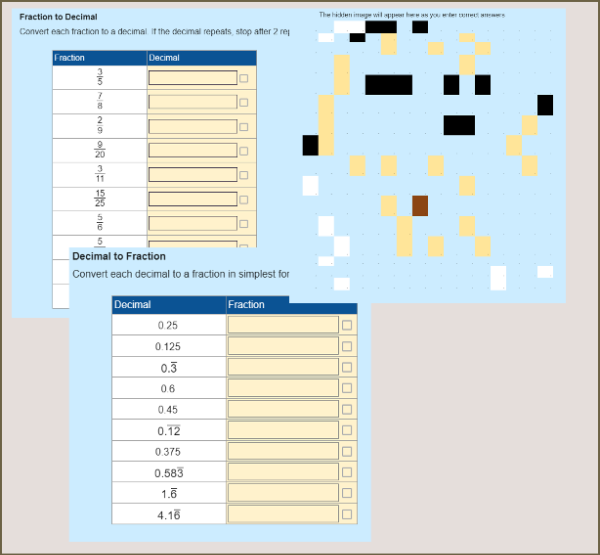
Practice converting fractions and decimals with this interactive 8th-grade math worksheet. Students convert fractions to decimals and decimals to fractions, identify terminating and repeating decimals, and receive instant feedback. Includes randomization so each student gets unique values, plus a fun pixel-art reveal to boost engagement.
Grade Levels: [8]
Duration: 20 minutes
Topics: ["Operations with Rational Numbers","Negative Numbers","Rational Approximations"]
Standards: ["8.NS.A.1"]

In this Thanksgiving-themed math worksheet, students convert ingredient quantities into standard units and calculate the cost of preparing a holiday meal. It’s a real-world activity that strengthens unit conversion, proportional reasoning, and budgeting skills.
Grade Levels: [7]
Duration: 20 minutes
Topics: ["Ratio","Unit Rate","Operations with Rational Numbers"]
Standards: ["7.RP.A.1","7.RP.A.2","7.EE.B.3"]
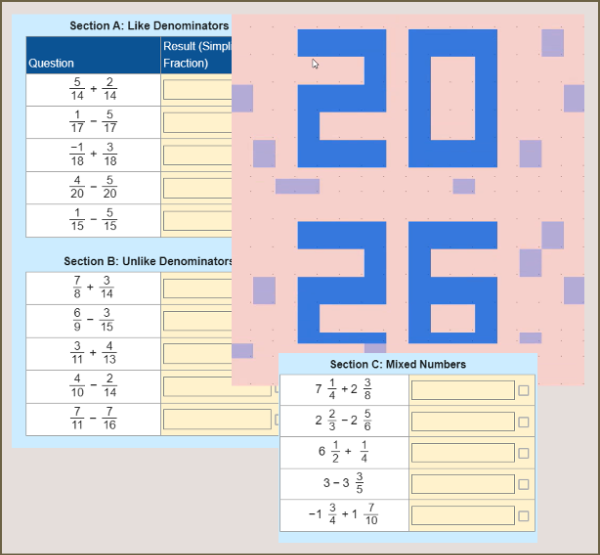
Engage students in adding and subtracting fractions and mixed numbers with this interactive Grade 7–8 math worksheet. Students work with like and unlike denominators, including positive and negative values, and enter answers as simplified fractions only. Built-in randomization gives each student unique problems, and a fun pixel-art reveal boosts motivation.
Grade Levels: [7,8]
Duration: 20 minutes
Topics: ["Operations with Rational Numbers","Negative Numbers"]
Standards: ["8.NS.A.1","7.NS.A.1"]
Students will use the simple interest formula and its variations to find the interest, principal to be deposited, and the interest rate they should be looking for to get $100,000 after 10 years for their dream house.
Grade Levels: [7]
Duration: 20 minutes
Topics: ["Percent Problems","Operations with Rational Numbers","Negative Numbers"]
Standards: ["7.RP.A.3","7.EE.B.3"]
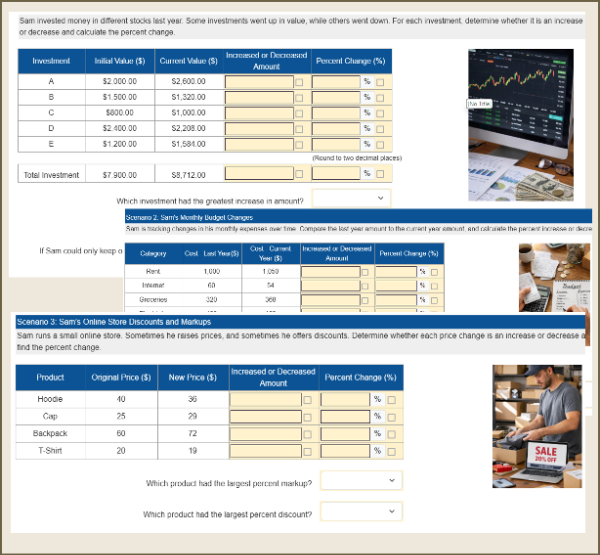
Students analyze real-world financial situations to calculate percent increase and decrease. Using a connected storyline, students examine changes in stock investments, monthly expenses, and online store prices. This worksheet builds proportional reasoning through table-based problems and supports randomized values for independent, auto-graded practice.
Grade Levels: [7]
Duration: 20 minutes
Topics: ["Ratio","Percent Problems","Operations with Rational Numbers","Rational Approximations"]
Standards: ["7.RP.A.3","7.EE.B.3"]
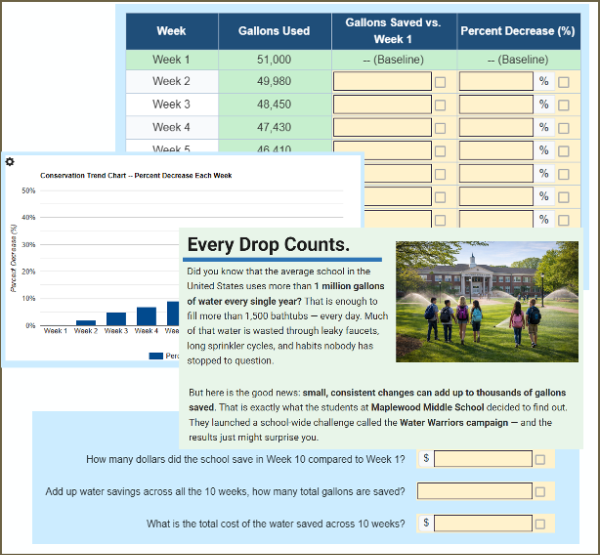
Interactive Grade 6 worksheet where students analyze 10 weeks of school water usage, calculate gallons saved, compute percent decreases, and complete a ratio table to track a conservation campaign. Auto-graded.
Grade Levels: [6]
Duration: 20 minutes
Topics: ["Ratio","Percent Problems"]
Standards: ["6.RP.A.3c","6.RP.A.1","6.SP.B.5"]
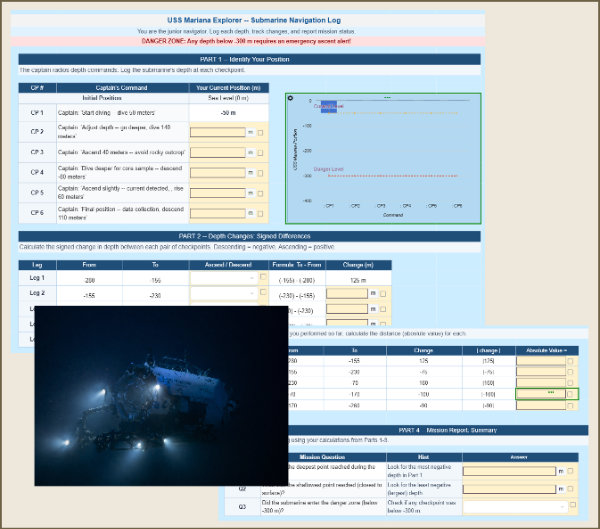
Grade 6 interactive worksheet where students navigate a research submarine through the Pacific Ocean, logging depths, calculating signed changes, and discovering absolute value. Auto-graded with randomized values.
Grade Levels: [6]
Duration: 25 minutes
Topics: ["Negative Numbers","Negative Numbers","Number Line Reasoning"]
Standards: ["6.NS.C.5","6.NS.C.6a","6.NS.C.7c","6.NS.C.7a","6.NS.C.7b"]
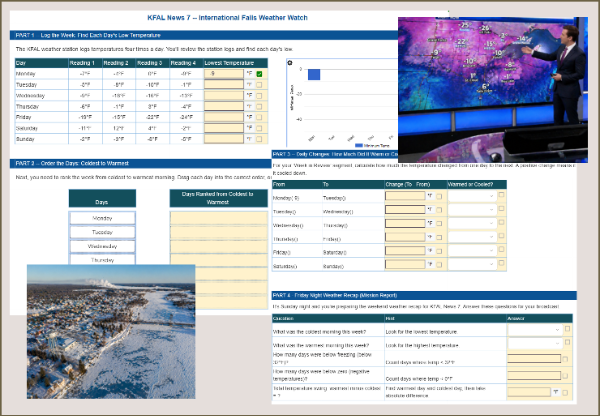
Interactive Grade 6 worksheet where students play junior meteorologist at KFAL News 7, logging January low temps in International Falls, ordering days by temperature, writing inequalities, calculating daily swings, and delivering a Friday Night Weather Recap. Auto-graded.
Grade Levels: [6]
Duration: 20 minutes
Topics: ["Negative Numbers","Negative Numbers","Number Line Reasoning"]
Standards: ["6.NS.C.7a","6.NS.C.7b","6.NS.C.6c","6.NS.C.5"]
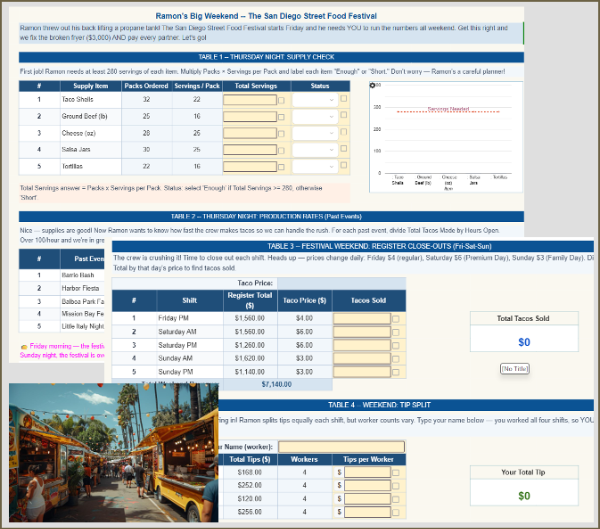
Step in as Ramon's assistant and run the numbers for a 4-day San Diego food truck festival. Multiply, divide, and track revenue across 5 sequenced tables. Auto-graded, randomized, Grade 6.
Grade Levels: [6]
Duration: 30 minutes
Topics: ["Operations with Rational Numbers","Negative Numbers"]
Standards: ["6.NS.B.2","6.NS.B.3","6.RP.A.1"]
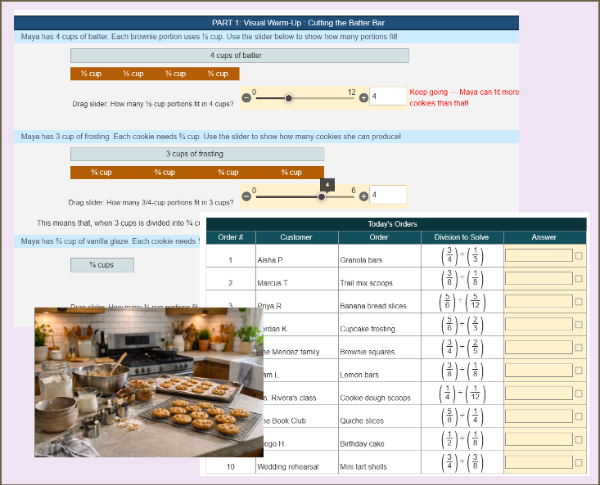
Step into Maya's home bakery and solve real order tickets using fraction division. Interactive sliders, live order boards, and a dynamic baking dashboard make this auto-graded Grade 6 worksheet an engaging way to master dividing fractions by fractions.
Grade Levels: [6]
Duration: 20 minutes
Topics: ["Operations with Rational Numbers","Negative Numbers"]
Standards: ["6.NS.A.1"]
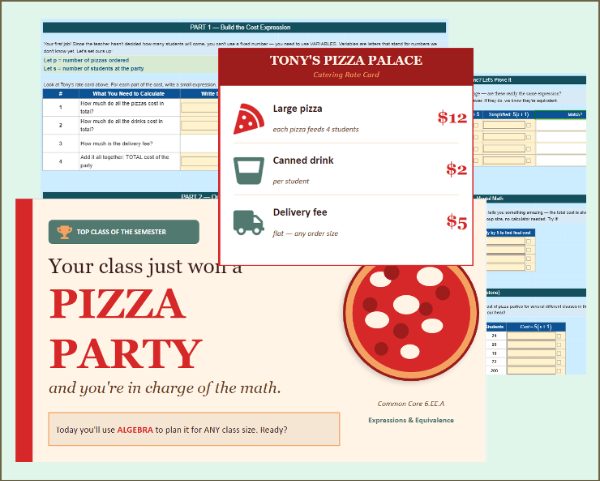
Your class just won a pizza party - now plan it with algebra! Students use Tony's Pizza Palace rate card to build a cost expression, then simplify 12p + 2s + 5 into 5(s + 1) - a shortcut so clean they can do the math in their heads. This 6-part interactive worksheet makes 6.EE.A.3 feel like a superpower, not a chore.
Grade Levels: [6]
Duration: 30 minutes
Topics: ["Solving Equations","Using Variables in Context","Linear Equations"]
Standards: ["6.EE.A.2","6.EE.A.2a","6.EE.A.2b"]
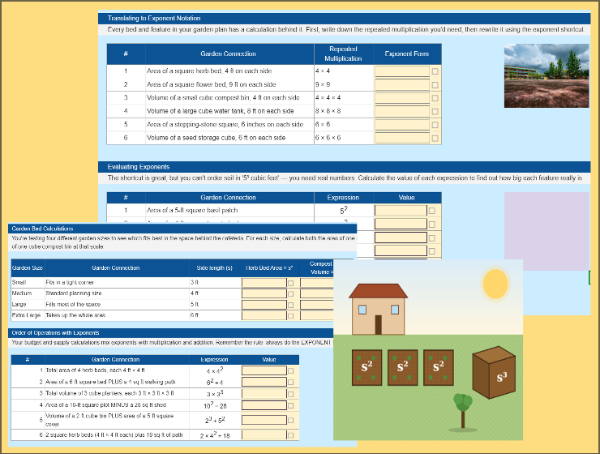
Help plan Westside Middle School's new garden using the power of exponents! Students calculate square herb bed areas, cube compost bin volumes, and test different garden sizes behind the cafeteria. This interactive activity teaches exponent notation, evaluation, and order of operations through real planning decisions — making 6.EE.A.1 feel like engineering, not homework.
Grade Levels: [6]
Duration: 20 minutes
Topics: ["Properties of Exponents","Scientific Notation"]
Standards: ["6.EE.A.1"]
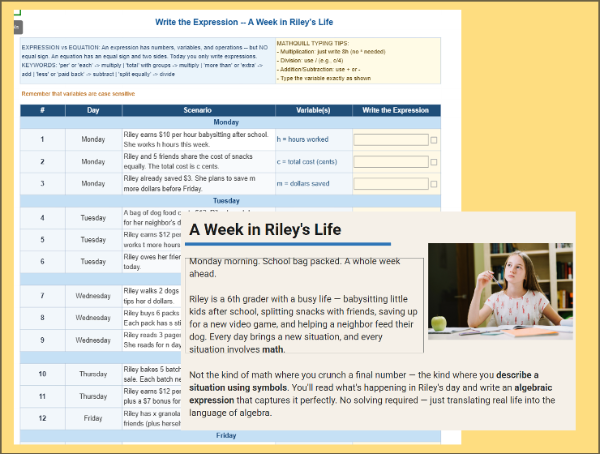
Interactive Grade 6 worksheet where students follow Riley through 15 real-life scenarios across a full week and write algebraic expressions using given variables. Auto-graded with equation input. Randomization supported.
Grade Levels: [6]
Duration: 20 minutes
Topics: ["Using Variables in Context","Linear Equations"]
Standards: ["6.EE.A.2a","6.EE.A.2b"]
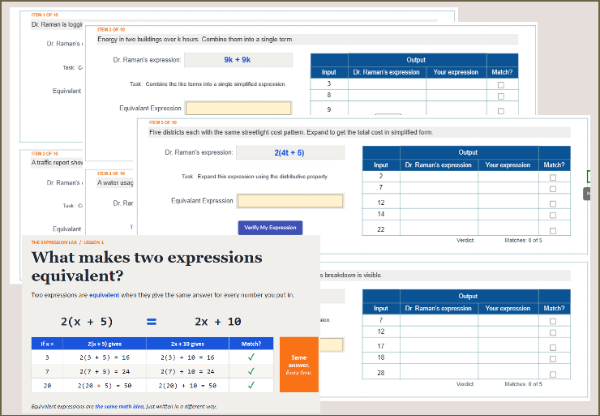
Interactive 6th grade math worksheet on equivalent expressions (CCSS 6.EE.A.3). Students help Dr. Raman, a city data scientist, rewrite 10 expressions by combining like terms, distributing, and factoring the GCF. Auto-graded with instant feedback: every answer is tested at 5 different inputs. Real-world scenario, built-in randomization, no prep required.
Grade Levels: [6]
Duration: 20 minutes
Topics: ["Equivalent Expressions","Using Variables in Context"]
Standards: ["6.EE.A.3"]
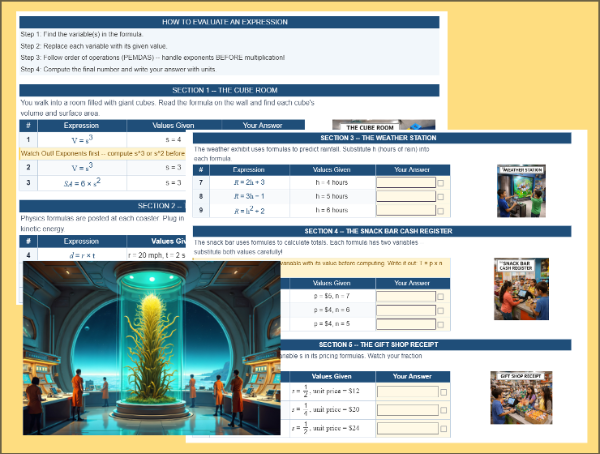
Interactive Grade 6 worksheet where students visit 5 science museum exhibits and evaluate real-world formulas by substituting given values. Covers exponents, fractions, and multi-variable expressions. Auto-graded with 15 problems.
Grade Levels: [6]
Duration: 20 minutes
Topics: ["Solving Equations","Using Variables in Context","Linear Equations"]
Standards: ["6.EE.A.2c","6.EE.A.2a"]
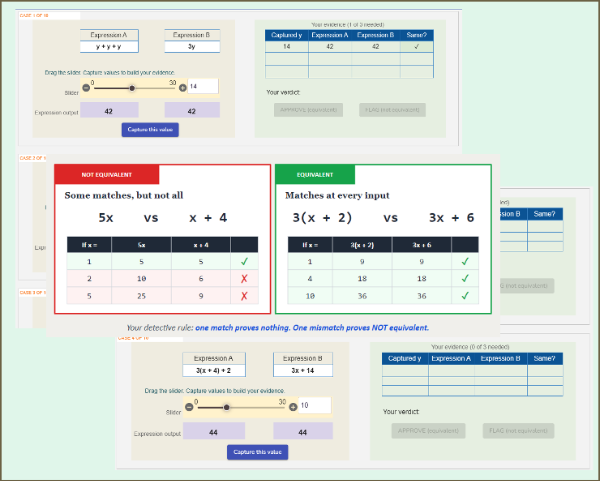
Interactive 6th grade worksheet on identifying equivalent expressions (CCSS 6.EE.A.4). Students audit 15 expression pairs submitted by Dr. Raman's junior analyst. Using a live slider and evidence-capture tool, they test values, hunt for mismatches, and decide APPROVE or FLAG. Auto-graded with instant feedback, no prep required, and perfect pair with Expression Lab 6.EE.A.3.
Grade Levels: [6]
Duration: 20 minutes
Topics: ["Equivalent Expressions"]
Standards: ["6.EE.A.4"]
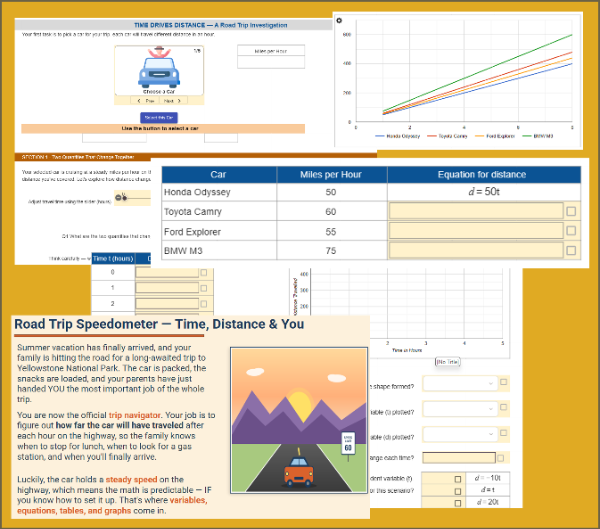
Pick a car, hit the highway, and discover how distance depends on time. Students write equations, build tables, plot graphs, and compare four vehicles to see why steeper lines mean faster speeds.
Grade Levels: [6]
Duration: 20 minutes
Topics: ["Solving Equations","Using Variables in Context","Linear Equations"]
Standards: ["6.EE.C.9"]
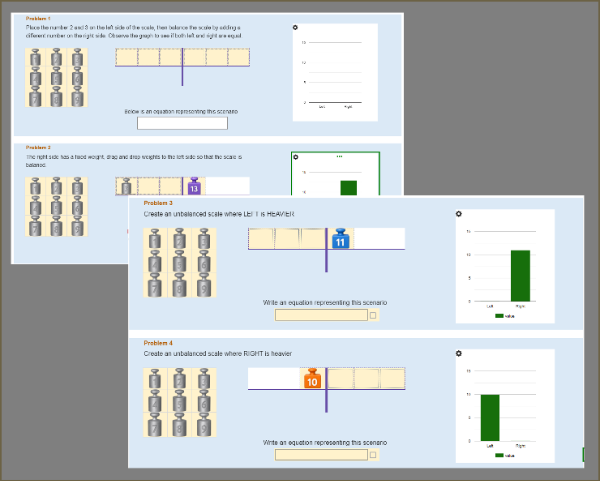
Interactive 6th grade worksheet on equations and inequalities (CCSS 6.EE.B.5, 6.EE.B.7, 6.EE.B.8). Students drag numbered weights onto a balance scale, observe a live bar chart showing both sides, then write the equation or inequality that represents their scale. 6 progressive problems: balance, make unbalanced, meet specific differences. Auto-graded, zero prep.
Grade Levels: [6]
Duration: 15 minutes
Topics: ["Solving Equations","Solving Inequalities"]
Standards: ["6.EE.B.5","6.EE.B.7","6.EE.B.8"]
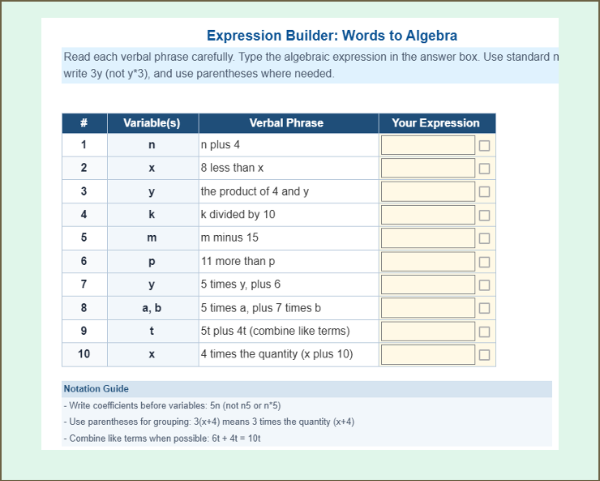
Interactive Grade 6 worksheet where students translate 10 verbal phrases into algebraic expressions - from simple one-operation phrases to two-operation and grouped expressions. Auto-graded with instant feedback.
Grade Levels: [6]
Duration: 5 minutes
Topics: ["Using Variables in Context"]
Standards: ["6.EE.A.2a"]
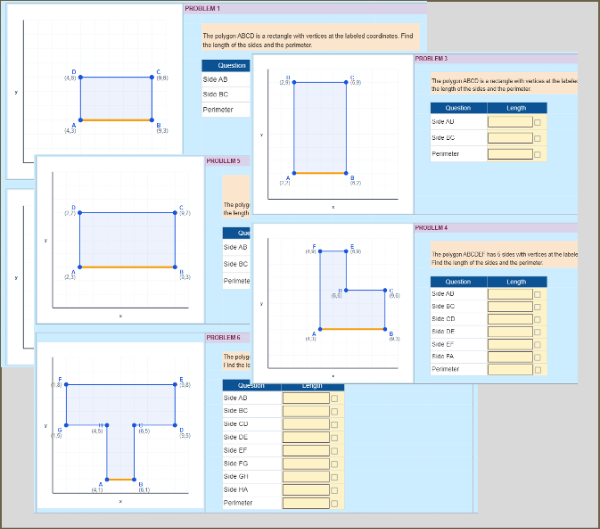
Interactive 6.G.A.3 practice for finding polygon side lengths using coordinates. Six problems progress from rectangles and squares to concave L-shapes and T-shapes. Students subtract coordinates instead of counting grid squares, with instant per-side feedback and auto-graded perimeter calculations. Perfect for in-class practice, homework, or formative assessment in Grade 6 math.
Grade Levels: [6]
Duration: 20 minutes
Topics: ["Scale Drawings","Area and Circumference"]
Standards:
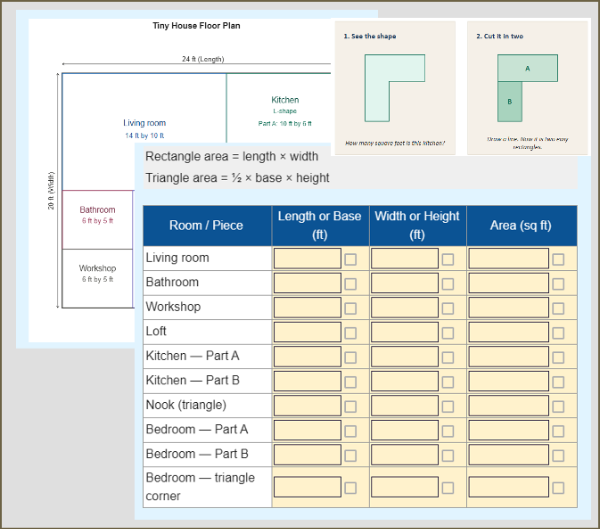
Short description (under 400 characters): Students design a tiny house floor plan and calculate room areas by decomposing composite shapes into rectangles and triangles. Real-world scenario with auto-grading, instant visual feedback, and cost estimation. Seven rooms including an L-shape, pentagon, and triangle. Aligned to 6.G.A.1. Grade 6 geometry. Interactive spreadsheet activity.
Grade Levels: [6]
Duration: 20 minutes
Topics: ["Area and Circumference"]
Standards: ["6.G.A.1"]
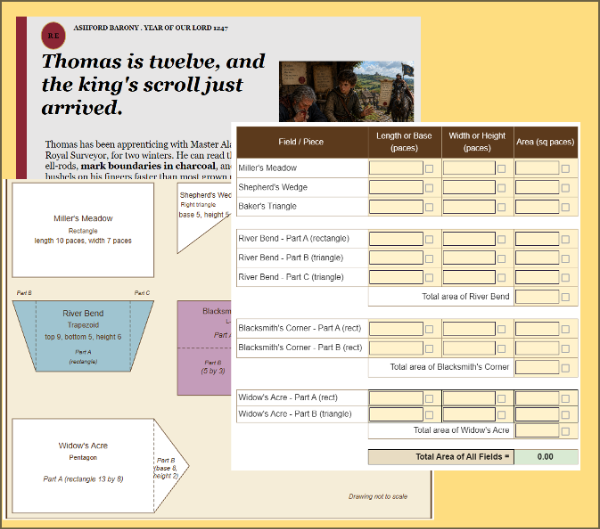
Step into Medieval Ashford as an apprentice surveyor measuring seven fields for the king's tax. Students decompose rectangles, triangles, trapezoids, L-shapes, and pentagons into simple pieces, calculate areas, and convert to bushels. Interactive scroll fills with color as answers are correct. Auto-graded. Common Core 6.G.A.1.
Grade Levels: [6]
Duration: 20 minutes
Topics: ["Scale Drawings","Area and Circumference"]
Standards: ["6.G.A.1"]
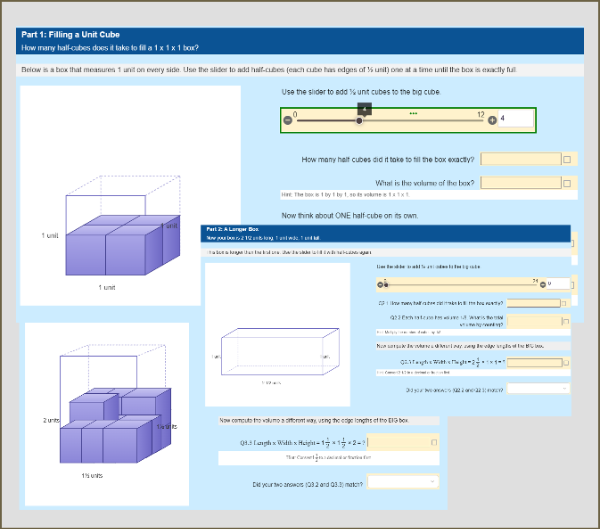
Interactive 6.G.A.2 worksheet where students fill three rectangular prisms with half-unit cubes using a slider, then verify volume two ways: counting (cubes × 1/8) and formula (L × W × H). Students discover why V = L × W × H works for fractional edge lengths through hands-on packing of 1×1×1, 2½×1×1, and 1½×1½×2 boxes. Auto-graded. Grade 6.
Grade Levels: [6]
Duration: 15 minutes
Topics: ["Volume and Surface Area"]
Standards: ["6.G.A.2"]
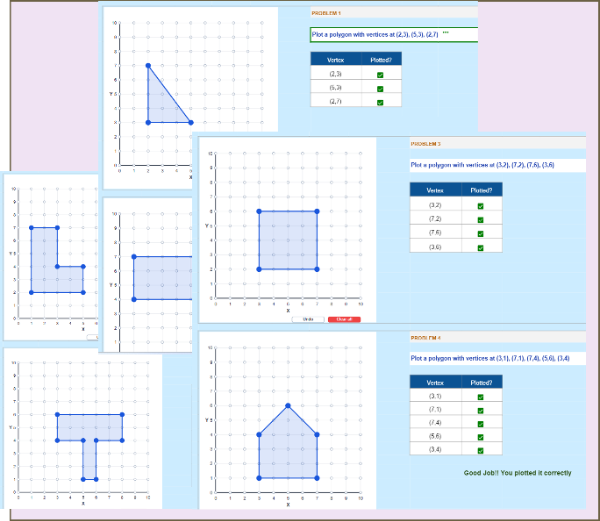
Interactive 6.G.A.3 practice for plotting polygons on the coordinate plane. Six problems progress from triangles and rectangles to pentagons and concave shapes. Students click grid points to plot vertices and get instant per-vertex feedback. Auto-graded with checkmark validation. Perfect for in-class practice, homework, or formative assessment in Grade 6 math.
Grade Levels: [6]
Duration: 20 minutes
Topics: ["Scale Drawings"]
Standards: ["6.G.A.3"]
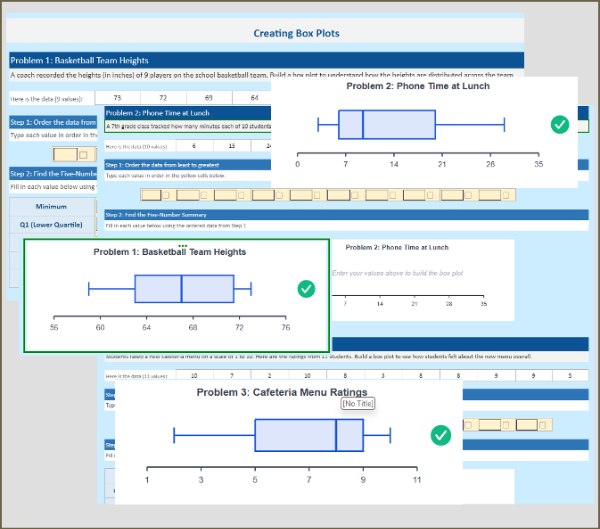
Build fluency with box plots through 3 real-world practice problems. Students sort data, find the five-number summary (Min, Q1, Median, Q3, Max), calculate IQR, and watch the box plot draw itself as they fill in each value. Each problem features a different distribution shape, with instant feedback when answers are correct.
Grade Levels: [6,7]
Duration: 20 minutes
Topics: ["Measures of Center and Spread","Interpreting Data"]
Standards: ["6.SP.B.4","7.SP.B.3"]
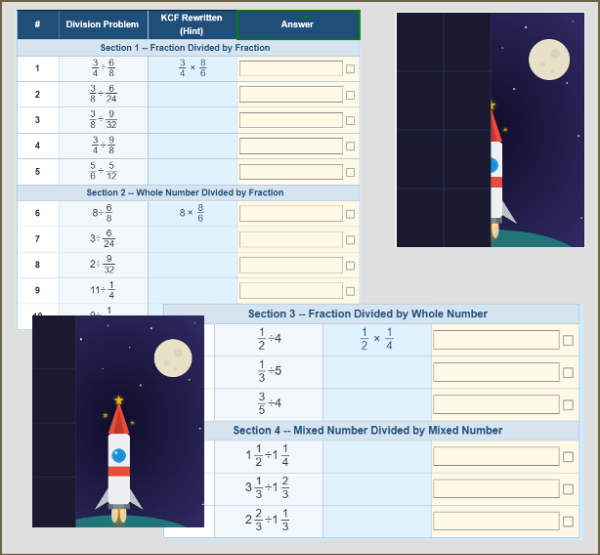
Interactive Grade 6 worksheet where students practice dividing fractions using the Keep-Change-Flip strategy across four progressive sections. 16 problems total, auto-graded with immediate feedback.
Grade Levels: [6]
Duration: 20 minutes
Topics: ["Operations with Rational Numbers","Negative Numbers"]
Standards: ["6.NS.A.1","6.NS.B.4"]
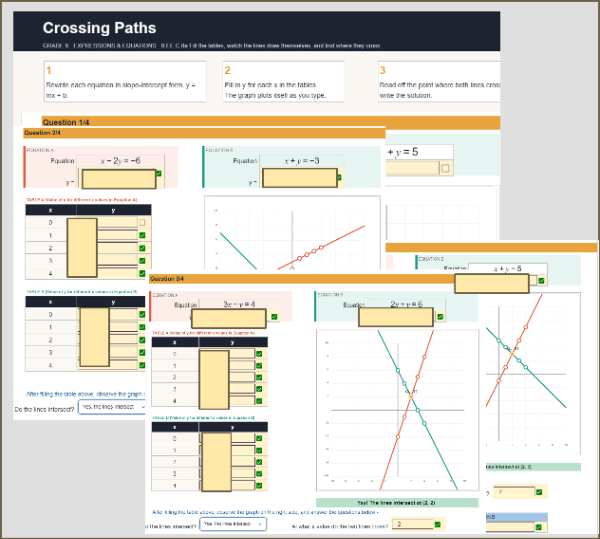
Make solving systems of linear equations click with this interactive, auto-graded 8th grade worksheet (CCSS 8.EE.C.8a). Students convert equations from standard to slope-intercept form, complete tables of values, and watch each line draw itself on a live coordinate graph that marks the intersection point. Four problems rise in difficulty, ending with a decimal-answer challenge that proves why graphing alone isn't enough.
Grade Levels: [8]
Duration: 20 minutes
Topics: ["Solving Equations","Systems of Equations"]
Standards: ["8.EE.C.8a"]
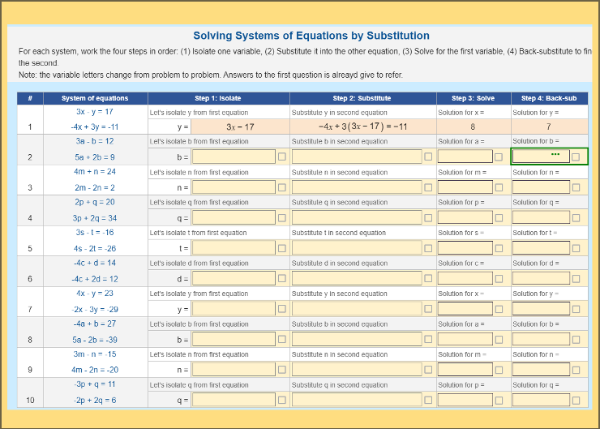
Build 8th grade fluency with solving systems of equations by substitution. This interactive, auto-graded worksheet walks students through a clear four-step method: isolate, substitute, solve, and back-substitute. Ten scaffolded problems with varied variables and instant feedback. Aligned to Common Core 8.EE.C.8b. Randomization supported to prevent answer copying.
Grade Levels: [8]
Duration: 20 minutes
Topics: ["Solving Equations","Systems of Equations","Solving Linear Equations and Inequalities"]
Standards: ["8.EE.C.8b"]
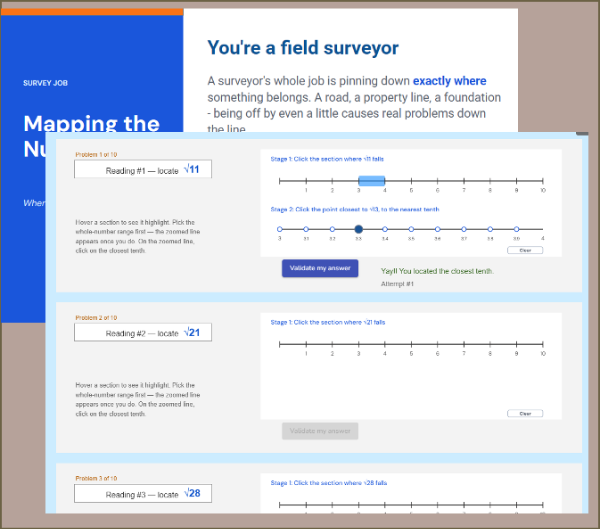
Interactive 8th grade number line worksheet for locating irrational square roots (8.NS.A.2). Students click to place values like √13 between whole numbers, then zoom in to estimate to the nearest tenth, with instant validation and feedback. Auto-graded, randomized per student, and built around a real-world surveyor scenario that makes estimation feel purposeful.
Grade Levels: [8]
Duration: 20 minutes
Topics: ["Irrational Numbers","Rational Approximations"]
Standards: ["8.NS.A.2"]
Interactive 8.EE.A.4 practice on operations with scientific notation. Students add, subtract, multiply, and divide in a space themed lab, with instant coefficient and exponent checking, a magnitude meter for number sense, and built in randomization so every student gets a unique version. Includes a student intro guide and answer key.
Grade Levels: [8]
Duration: 20 minutes
Topics: ["Scientific Notation"]
Standards: ["8.EE.A.4"]
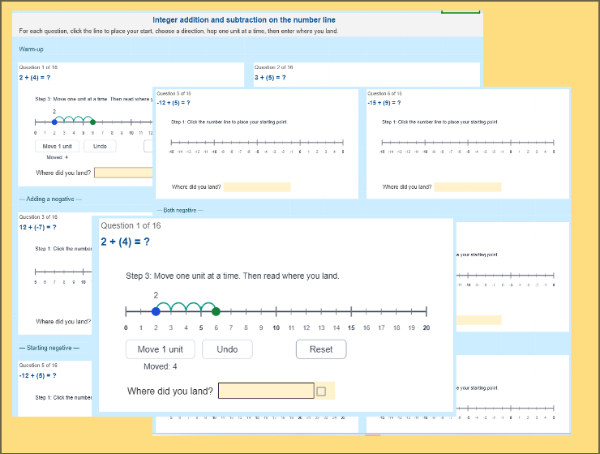
Interactive number line worksheet for 7th grade integer operations (7.NS.A.1). Students place a start, choose direction, and hop unit by unit to add and subtract integers. 16 auto-checking problems build from simple sums to the tricky subtract-a-negative case. Self-correcting, visual, and engaging. Includes a student intro slideshow. No prep required.
Grade Levels: [7]
Duration: 20 minutes
Topics: ["Operations with Rational Numbers","Negative Numbers","Negative Numbers","Number Line Reasoning"]
Standards: ["7.NS.A.1"]

Turn GCF and LCM into a real job. In this interactive Spring Festival worksheet, students pack fair goodie bags (GCF) and sync ride and show schedules (LCM) across 18 auto-graded problems. Every item connects the math to a reason, with instant feedback as students type. Common Core 6.NS.B.4. Randomization-ready, so each student can get unique numbers.
Grade Levels: [6]
Duration: 15 minutes
Topics: []
Standards: ["6.NS.B.4"]
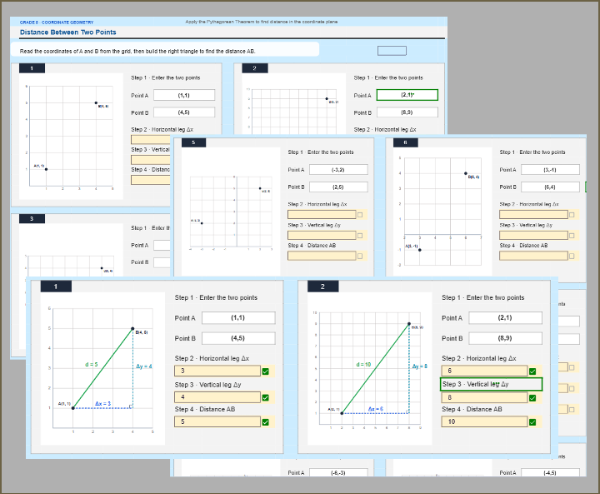
Turn the distance formula into something students can see. On an interactive coordinate grid, students read two points, build the horizontal and vertical legs, and watch a right triangle form before applying the Pythagorean Theorem to find the distance. Ten auto-graded problems progress from clean whole-number triangles to mixed-quadrant challenges. Aligned to 8.G.B.8.
Grade Levels: [8]
Duration: 20 minutes
Topics: ["Pythagorean Theorem"]
Standards: ["8.G.B.8"]
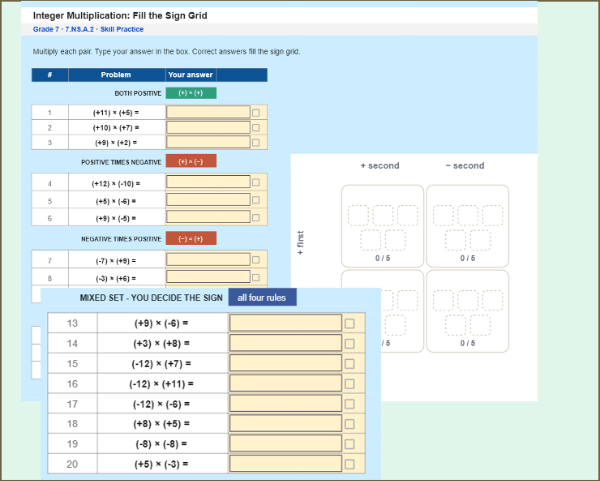
Interactive integer multiplication practice for Grade 7. Students multiply across all four sign combinations while a live sign grid fills in as they answer, turning the sign rules into a visual pattern they build themselves. Auto-graded, standards-aligned to 7.NS.A.2, with optional randomization so every student gets a unique problem set. Great for practice, remediation, and retakes.
Grade Levels: [7]
Duration: 15 minutes
Topics: ["Negative Numbers","Negative Numbers"]
Standards: ["7.NS.A.2"]
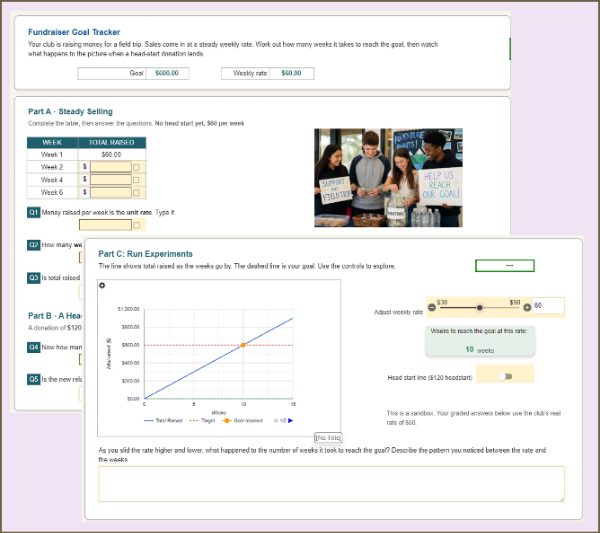
Interactive proportional relationships simulation. Students track a club fundraiser at a steady weekly rate, predict weeks to the goal, then see how a head-start donation breaks proportionality. Live graph, auto-graded, randomized values. Grades 7-8 review. CCSS 7.RP.A.2.
Grade Levels: [8]
Duration: 10 minutes
Topics: ["Ratio","Unit Rate","Proportional Relationships"]
Standards: ["7.RP.A.2"]
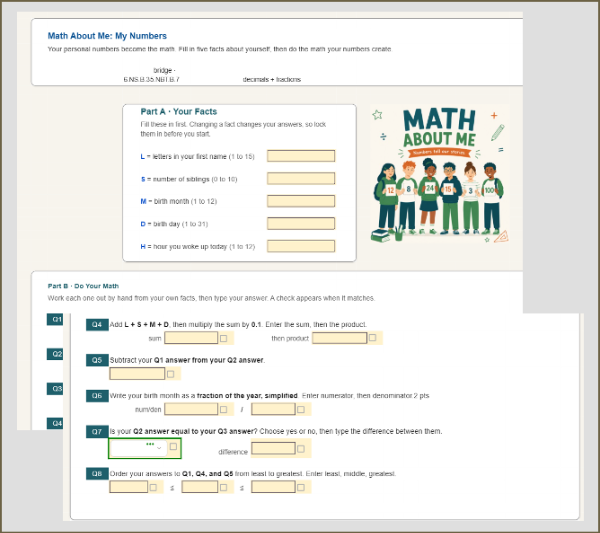
Interactive back-to-school math activity. Students turn five personal facts into decimal and fraction practice, then get instant auto-graded feedback. Every worksheet computes different answers because the inputs are the student. Grades 6-8 review. CCSS 6.NS.B.3, 6.NS.B.4.
Grade Levels: [6]
Duration: 10 minutes
Topics: ["Operations with Rational Numbers"]
Standards: ["6.NS.B.3","6.NS.B.4"]
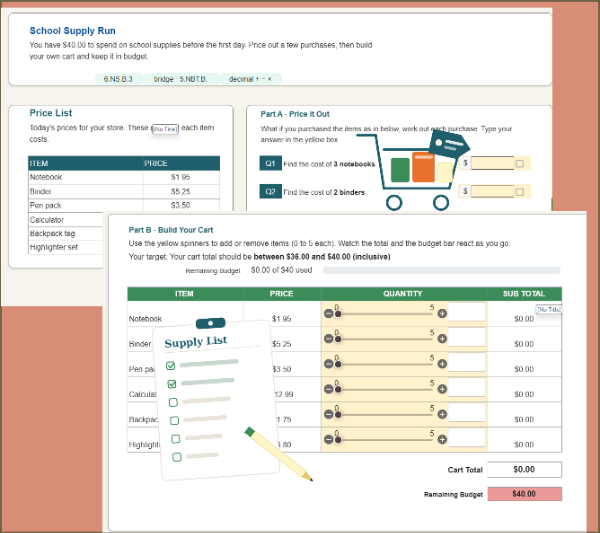
Interactive back-to-school budgeting worksheet. Students spend a $40 budget on school supplies, practicing decimal add, subtract, and multiply. Auto-graded with a live budget bar and build-your-own-cart activity. Randomized values, grades 6-8 review. CCSS 6.NS.B.3.
Grade Levels: [6]
Duration: 15 minutes
Topics: ["Unit Rate","Operations with Rational Numbers","Negative Numbers"]
Standards: ["6.NS.B.3"]
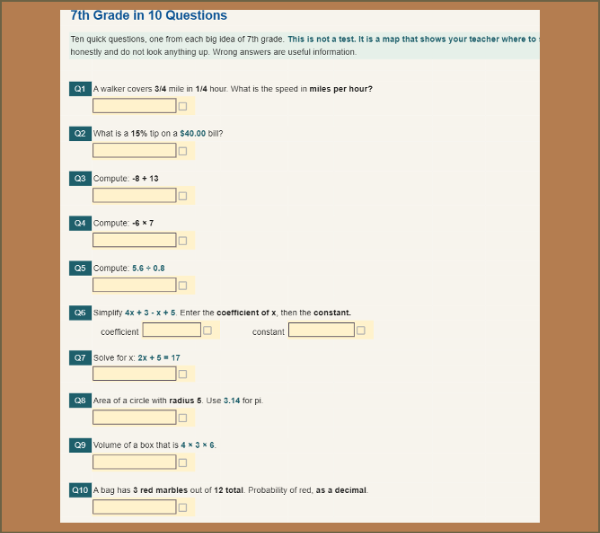
A fast, auto-graded readiness check that covers all ten big ideas of 7th grade in ten questions. Perfect for day one or two of 8th grade. Each question maps to one standard and scores separately, so your class dashboard becomes a heatmap showing exactly which skills are solid and which need review. Not a test, a map. Randomized values. CCSS 7.RP, 7.NS, 7.EE, 7.G, 7.SP.
Grade Levels: [8]
Duration: 15 minutes
Topics: ["Ratio","Ratio","Unit Rate"]
Standards: ["7.RP.A.1","7.RP.A.3","7.NS.A.1","7.NS.A.2","7.NS.A.3","7.EE.A.1","7.G.B.4","7.G.B.6","7.SP.C.7"]
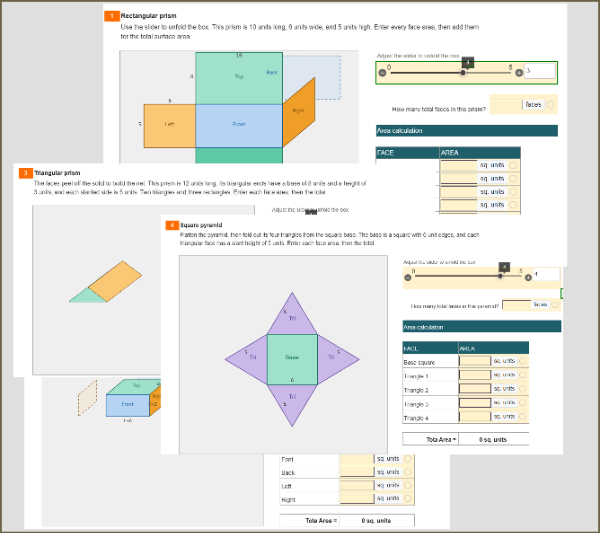
Stop asking students to imagine how a box unfolds. Let them watch it. A slider opens each solid into its net one face at a time, so students see exactly where every face comes from before they calculate its area. Four auto-graded problems cover 6.G.A.4: two rectangular prisms, a triangular prism, and a square pyramid. Zero prep, instant feedback.
Grade Levels: [6]
Duration: 20 minutes
Topics: ["Volume and Surface Area"]
Standards: ["6.G.A.4"]
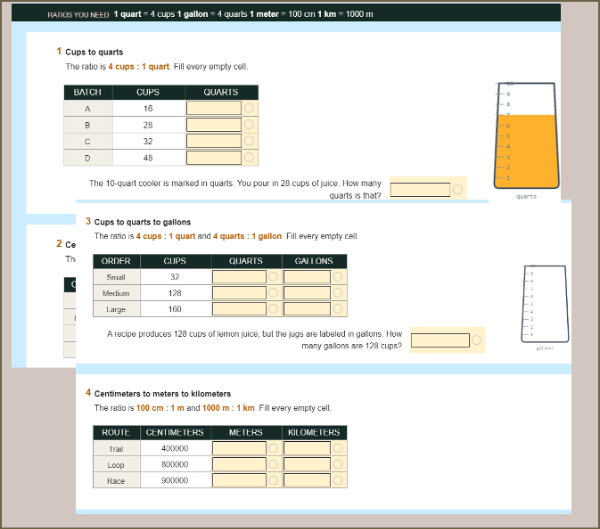
Convert It: Ratio Reasoning with Units gets Grade 6 students converting measurement units through interactive ratio tables with instant feedback. Covers cups-to-quarts, centimeters-to-meters, and two-step chains (cups→quarts→gallons, cm→m→km). Animated cooler graphics catch magnitude errors visually. Randomization gives every student unique numbers. Aligned to 6.RP.A.3d.
Grade Levels: [6]
Duration: 20 minutes
Topics: ["Unit Rate","Proportional Relationships"]
Standards: ["6.RP.A.3d"]
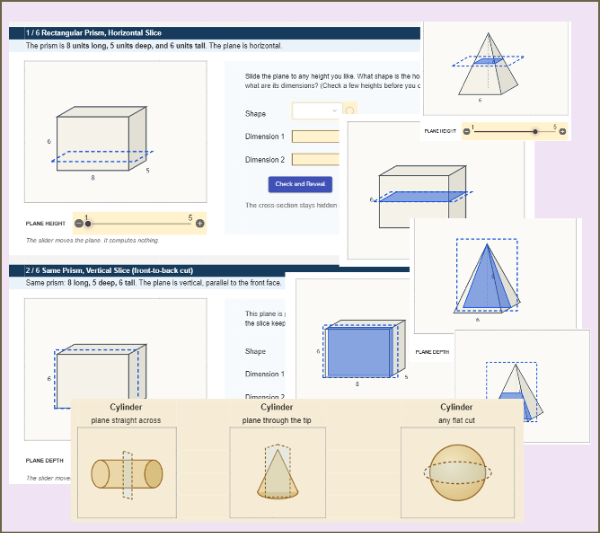
Interactive cross-sections activity for 7.G.A.3. Students slice rectangular prisms and square pyramids, name each 2D cross-section, and compute its dimensions from the solid's measurements. A move-the-plane slider lets them explore before committing, with answers revealed only when correct. Includes curved-solid extensions. Self-checking and no-prep.
Grade Levels: [7]
Duration: 15 minutes
Topics: ["Volume of Cylinders, Cones, and Spheres"]
Standards: ["7.G.A.3"]
All activities are designed to engage students with real-world applications and interactive learning experiences.
View Interactive Activities Page